- Document History
- Subscribe to RSS Feed
- Mark as New
- Mark as Read
- Bookmark
- Subscribe
- Printer Friendly Page
- Report to a Moderator
- Subscribe to RSS Feed
- Mark as New
- Mark as Read
- Bookmark
- Subscribe
- Printer Friendly Page
- Report to a Moderator
In the 2013 Biomedical Toolkit, the Biosignal Viewer provides many new features for the annotation, virtual channels, measurements, and save functions.
Main New Features and Improvements
- Smoothly display large biosignal files (up to 40GB TDMS files)
- Filter/add/edit/delete annotations for existing files
- Virtual channel support, including filtering, math, integral, differentiation, etc.
- Support for new measurements, including max/min and statistics
- Save annotations/virtual channels to existing files
- Save channel subsets/annotations to new files
Using Annotations
Click Annotation in the Biosignal Viewer to open the Annotation dialog box. Use this dialog box open to filter, add, edit, and delete annotations.

Filter Annotations
In the Annotation dialog box, you can filter annotations by set or name or according to further advanced options, including time range and channel. The filtered annotation results appear in the Results list and on the graphs.
- Filter by Set: By default, the Results list lists the annotations of the first Set. Click the pull-down menu on the right side of the Set control and select one or multiple sets of annotations to view them.
- Filter by Name: Input any part of annotation name you want to find in the Name field to filter the annotations by name.
- Filter by Advanced Options: Click Advanced to expand the dialog box to show two more filter options—Channel and Time Range. Check Channel and use the pull-down menu to select one or multiple channels to get all the annotations that are snapped to these channels. Check Time Range and move the two slide controls to get the annotations that are located within the specified time range. Click Update to refresh the Results list.
Go to Annotation Plot
In the Annotation dialog box, select an annotation row in the Results list and click Go To to locate and plot the selected annotation on the graph. You can use <down> or <up> to locate the next or previous annotation, respectively.
Add an Annotation
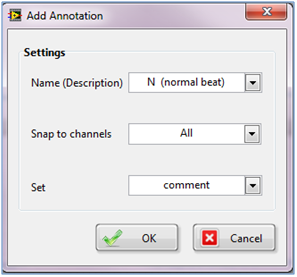
Right-click the graph and select Add Annotation Here to display the Add Annotation dialog box. In the Add Annotation dialog box, you can set the Name (Description), Snap to Channels and Set properties of an annotation.

- Name (Description): You can select an existing Name (Description) or click Custom Annotation to add a new annotation type. In the Custom Annotations… dialog box, input a Name and Description to add a custom annotation type.

- Snap to channels: Select the channels to snap. By default, this annotation will snap all the channels. If you deselect one of the listed channels, the annotation will not snap to the deselected channel. However, when you add a virtual channel, this annotation will snap to the new channel automatically.
- Set: You can select an existing set or click New Tag to add a new set.
Edit/Move an Annotation
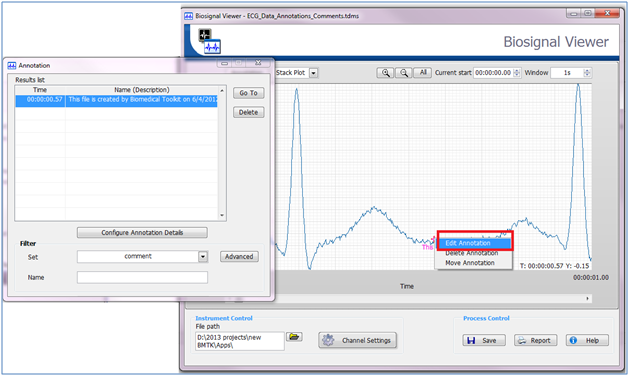
In the Annotation dialog box, double-click the row you want to edit from the Results list. Next, use the pull-down menu to select one of the existing annotation types. Alternatively, you can click Custom Annotations to add a new annotation type.
You can also right-click an annotation to activate its short-cut menu and select Edit Annotation.

Right-click an annotation to activate its short-cut menu and select Move Annotation. When the annotation turns red, you can use <Right> and <Left> to change the position of this annotation.
Delete an Annotation
In the Annotation dialog box, click Delete to delete the selected annotation from the Results list. You can also right-click the annotation on the graph and select Delete Annotation to delete it.
Add Virtual Channels
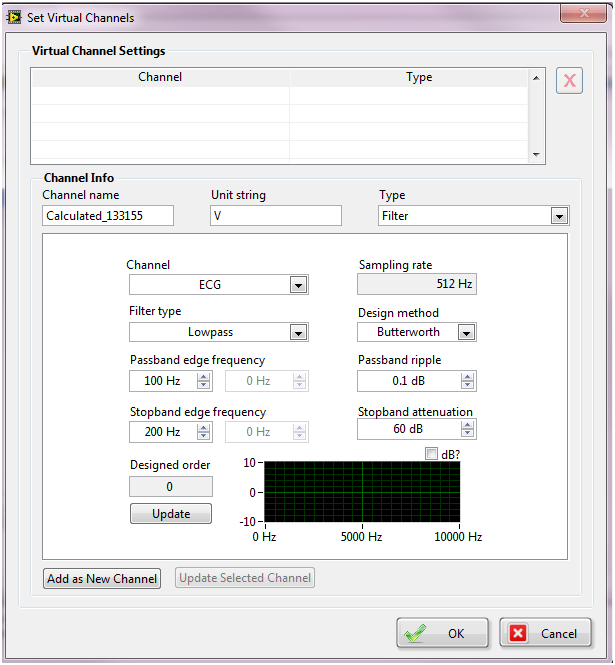
Click Channel Settings in the Biosignal Viewer to open the Channel Settings dialog box. The new Set Virtual Channels control is shown in the Channel Settings dialog box.

Click this button to open the Set Virtual Channels dialog box. The dialog box options is the same as the virtual channel settings of the Biosignal Logger. Refer to the Biosignal Logger help for details.

Measurements:
In 2013, you can add two markers to perform such measurements as Delta T/Y, Max/Min and Statistics.
- Right-click the graph and select Set Markers.
- Select the measurement method from the controls shown.

Save
In 2013, the Biosignal Viewer supports the following saving options:
- Save the currently viewed virtual channels or annotations to the currently viewed TDMS file
- Save the currently viewed channels/annotations to a new TDMS file.
- Save a channel subset to a new TDMS file.
Click Save in the Biosignal Viewer to open the Save File dialog box. Note: Save is only enabled if the TDMS file you view was created by Biomedical Toolkit.

Save to the Currently Viewed File
- If one or more virtual channels are viewed, then you can select Save Virtual Channel.
- The Biosignal Viewer supports saving an entire channel but not a channel subset. Therefore, the Time Range configurations are disabled.
- If any annotations have been changed or added, you can select Save Annotation.
Saving to a New TDMS File
- In the Save File dialog box, change the File Path to save the biosignal as a new TDMS file.
- Select Save Channel(s) to save all currently viewed channels to the file.
- Configure Time Range to save a channel subset.

- Select Save Annotations to save the annotations (including the changes) for the viewed channels to a file.
- Mark as Read
- Mark as New
- Bookmark
- Permalink
- Report to a Moderator
sounds very powerful!!! when wil the 2013 version be released? thankyou![]()
- Mark as Read
- Mark as New
- Bookmark
- Permalink
- Report to a Moderator
It will be released in NI Week 2013! Just wait for several months.
Thanks!
ZJ Gu
