- Document History
- Subscribe to RSS Feed
- Mark as New
- Mark as Read
- Bookmark
- Subscribe
- Printer Friendly Page
- Report to a Moderator
- Subscribe to RSS Feed
- Mark as New
- Mark as Read
- Bookmark
- Subscribe
- Printer Friendly Page
- Report to a Moderator
EMG Analysis using LabVIEW Biomedical Toolkit
EMG (Electromyography) is similar to ECG which is very important in biosignal analysis. Surface EMG acquisition is also similar to ECG acquisition. We could use several electrodes attached on our skin and acquire the voltage changes using NI DAQ cards when amplified with an appropriate biosignal amplifier.
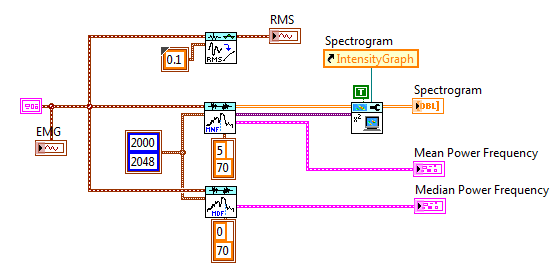
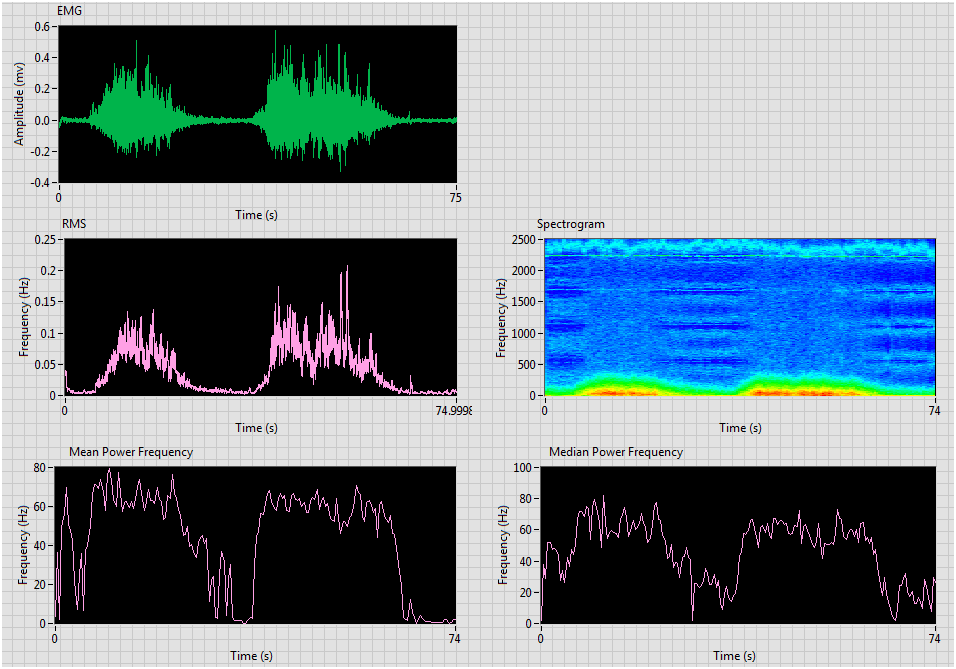
LabVIEW Biomedical Toolkit provides several functions for EMG analysis, such as RMS, spectrogram, median power frequency (MDF), mean power frequency (MNF).
Following is an example (you can find the example under NI Example Finder after you install Biomedical Toolkit) for EMG analysis. Biosignal RMS VI is used to calculate the RMS of EMG signal. EMG Median Power Frequency VI and EMG Mean Power Frequency VI are used to calculate the MDF and MNF. They also provide the spectrogram of EMG signal, which can be visualized using TFA Configure Spectrogram Indicator VI in LabVIEW Advanced Signal Processing Toolkit.

The result of this example is shown below:

- Mark as Read
- Mark as New
- Bookmark
- Permalink
- Report to a Moderator
Is this example generate simulated data, or we need some .txt files ?
