Using JavaScript and Google Charts with LabVIEW Web Services
- Subscribe to RSS Feed
- Mark as New
- Mark as Read
- Bookmark
- Subscribe
- Printer Friendly Page
- Report to a Moderator
Products and Environment
This section reflects the products and operating system used to create the example.To download NI software, including the products shown below, visit ni.com/downloads.
- LabVIEW
Software
Code and Documents
Attachment
Description
Description-Separate-1Overview
The example demonstrates to run JavaScript and Google Charts with LabVIEW Web Service.
Description
LabVIEW Web Services use a RESTful protocol for remote procedure calls over the web. This allows us to interact with LabVIEW code through standard web browsers.
However the direct output is not the best user interface and so many people want to put a thin client or webpage that parses this output and displays the data through a standard webpage. This example shows a very basic GUI using JavaScript to get the data and pass it to a chart using the Google Chart API. This is the first time I have done any JavaScript programming so I will try and link the useful documents I have used throughout as well.
Now I have done this I hope to produce a richer example running for remote monitoring of LabVIEW RT but this code should run on any target.
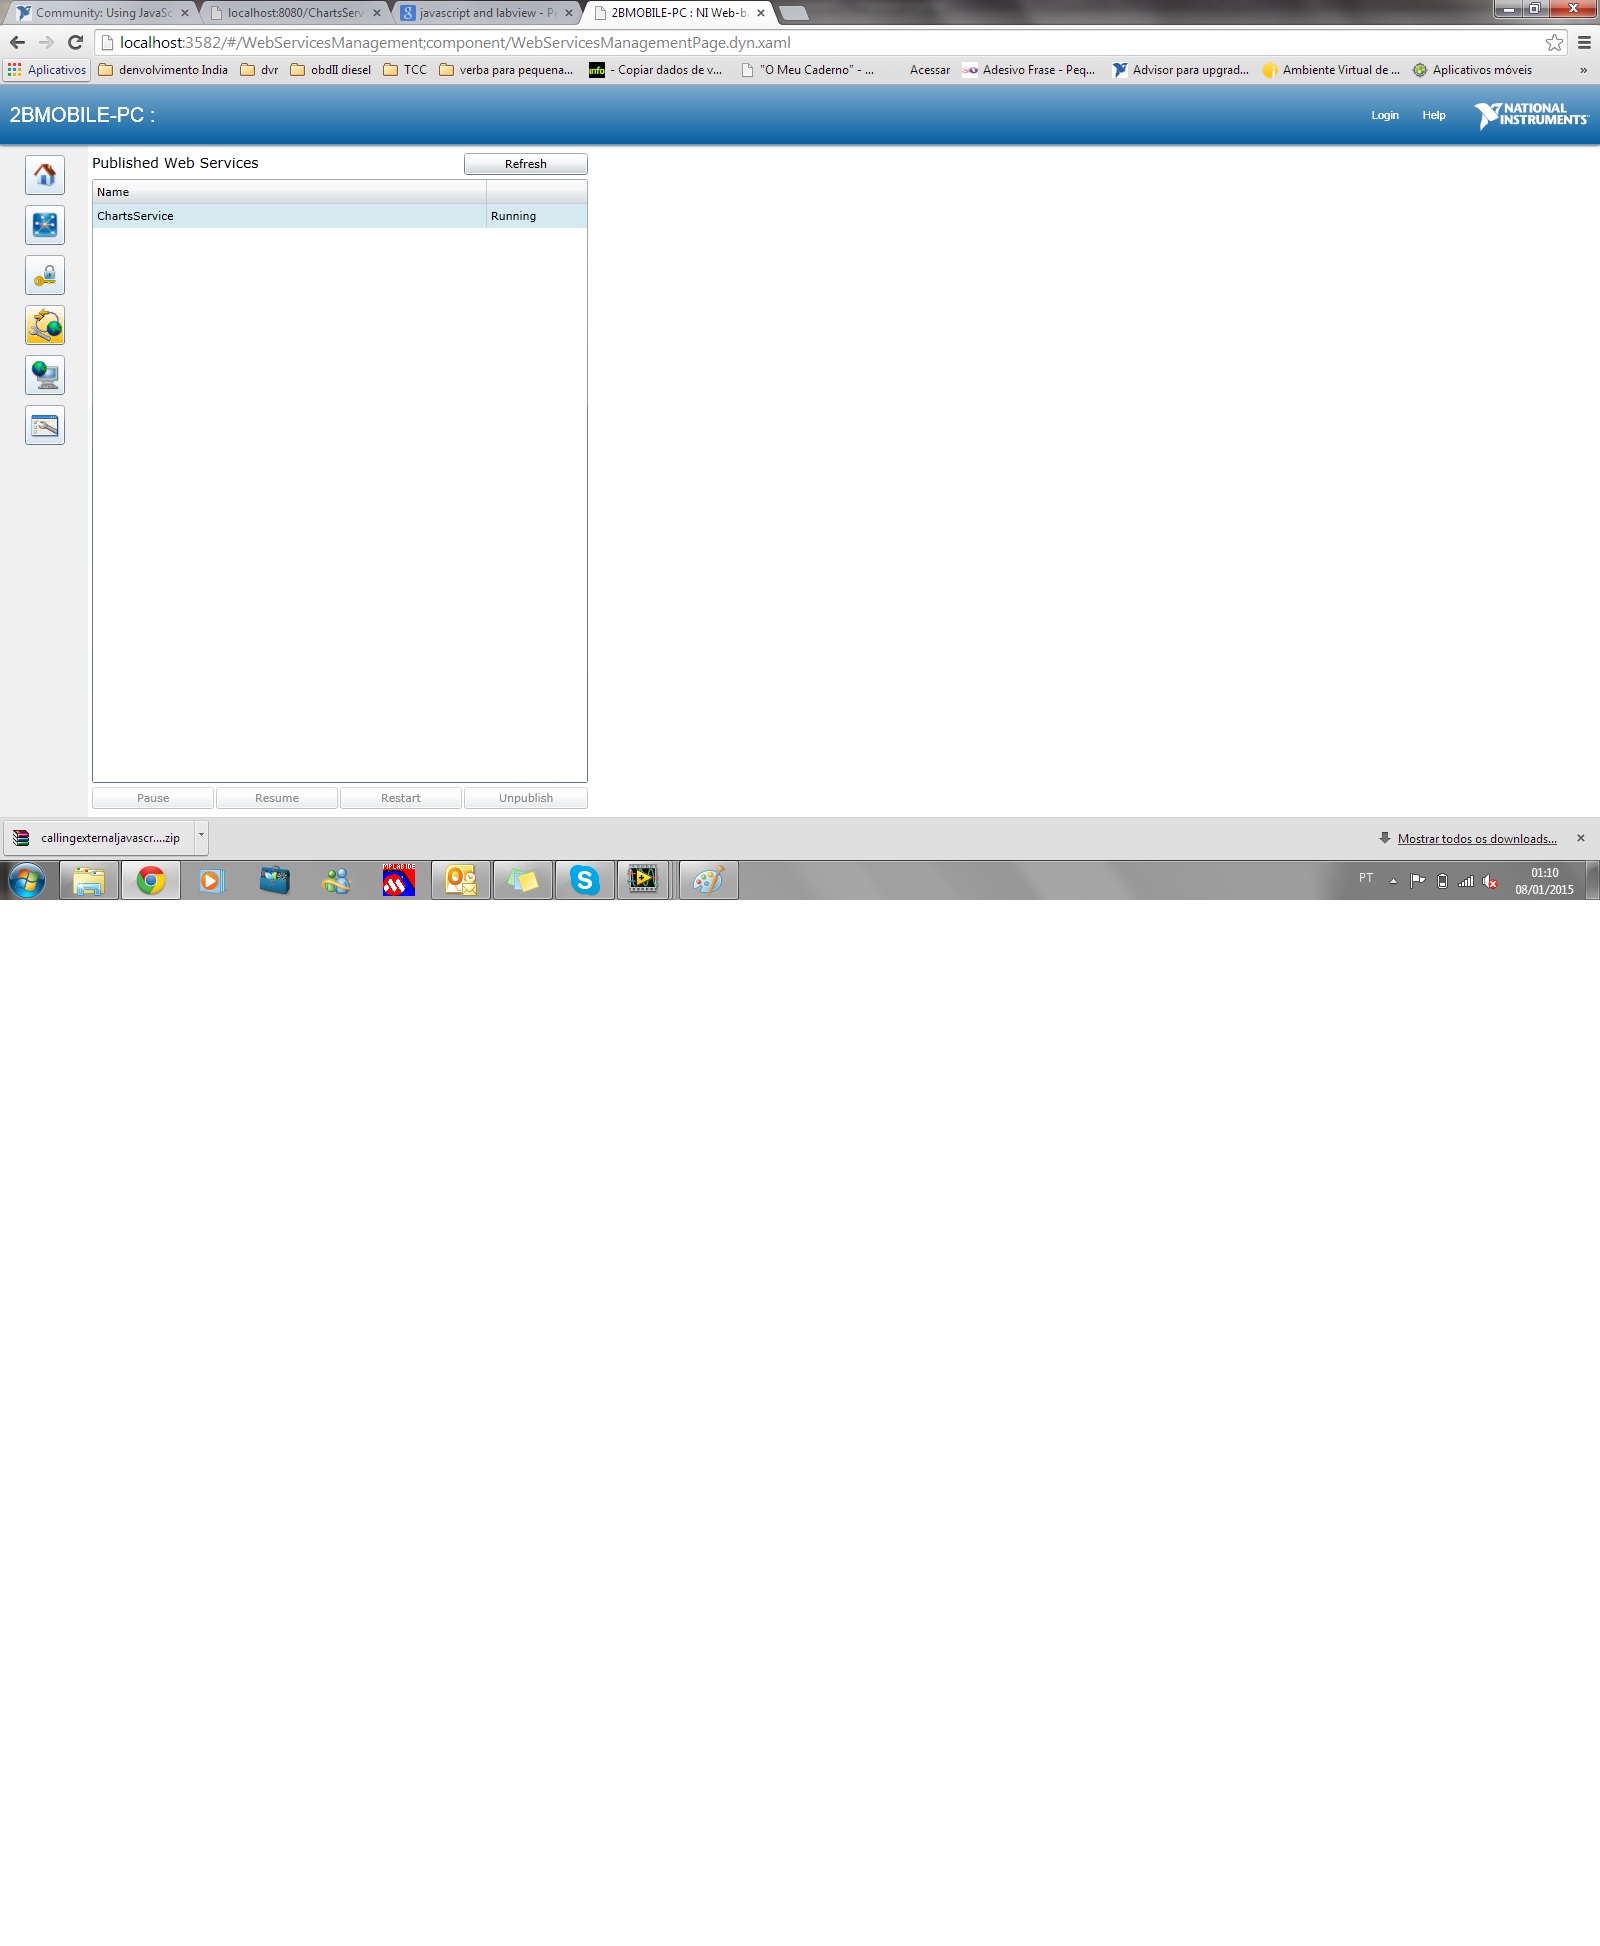
LabVIEW Web Service
I have purposely kept the web service simple (although the waveform type was not the easiest to get into the google charts!). It generates 100 random numbers and puts them into a waveform with t0 as the current time and dt of 10s.
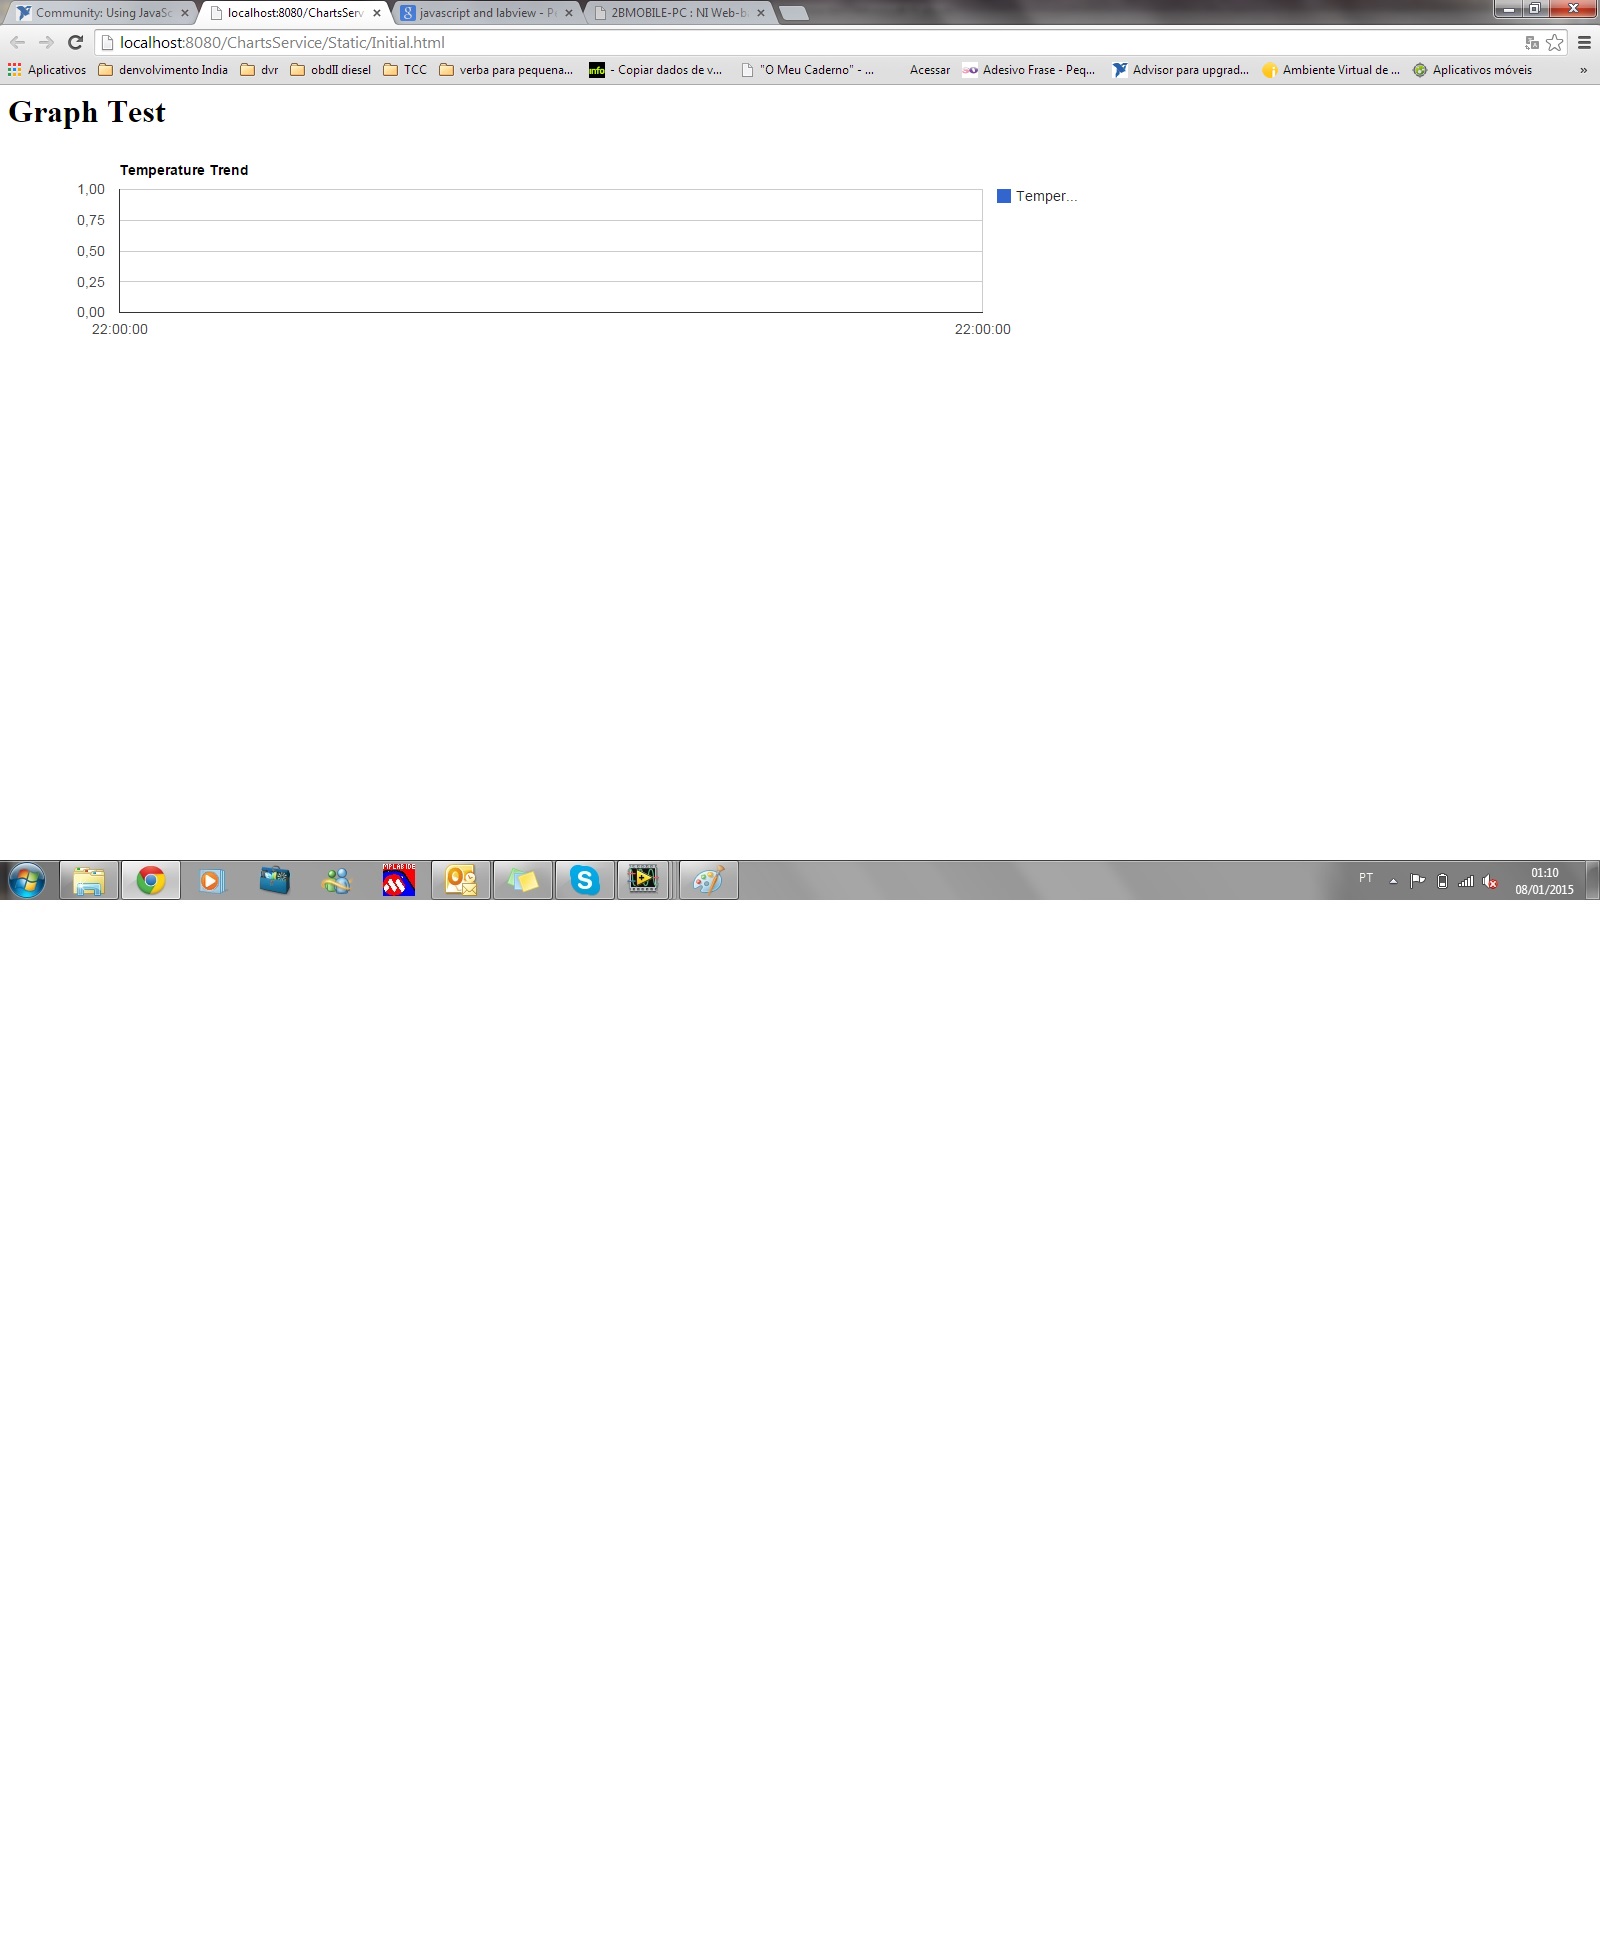
Static Web Page
Initial.html is a web page that I have added to the LabVIEW web service as a static page. It doesn't do much but provide a placeholder to tell the JavaScript where to place the graph. In the header of this is where you will find the invocation of the scripts. If you are unfamiliar with how to do this there is a help document in the LabVIEW help at https://www.ni.com/docs/en-US/bundle/labview/page/integrating-static-content-into-a-web-service-real....
JavaScript (Interface to Web Services)
This is done using the httpxmlrequest object which is made available as part of most modern browsers. The best help I found was to work through the details from W3C Schools on the object at https://www.w3schools.com/xml/ajax_xmlhttprequest_create.asp.
In this example you will find the relevant code in the RequestData function in loadgraph.js. Here we invoke the request to the web service with a static URL as it takes no input data.
The Web Service is configured to return the data as JSON (JavaScript Object Notation) which makes it very easy to load as an object in JavaScript. This is done by the JSON.parse function which is available in modern browsers. Some older browsers may not support this, if you need to use these then you can use the eval() function but this has the potential to run malicious scripts. See http://www.json.org/for more details.
Google Chart API
The google chart API is a JavaScript API that they have provided to produce rich graphs and data tables. All the documentation and some examples are provided as part of the projects page at https://google-developers.appspot.com/chart/. In particular, I found the quick start got me through this!
The downside to this is the web service client must have internet access to use this API, I don't believe the JavaScript version sends your data to google (the previous version did) but it is part of their terms of service that you do not download the API locally.
The quick start guide probably explains the detail far better than I could but there are essentially 3 steps that we must follow to achieve this.
- We must load the relevant parts of the API. In my example this consists of the external script in the head of the HTML page and then the first line of the loadgraph.js. The external script must always be called as is, the first line may need the package name changing for different style charts. You will find the relevant package at the top of the documentation for the chart on googles documentation.
- We must format our data into a data table. My code does this entirely in the LVWaveformtoGoogleDataTable() function (obviously specifically designed for waveform datatypes atm.) The best documentation on this is again as part of googles documentation for the DataTable object. In this case, because I need to create my time column on the fly (because it does not exist as part of a LabVIEW waveform) I have a for loop that adds each row. There is also a method for creating these tables as arrays which may be easier for simpler data types or you could even build the JSON in the web service if you really wanted to!
- Finally we must draw the graph, this is done in my LoadData() function. We do this by creating a chart and pointing it at a particular section of our HTML page (in my case the div I have named chart_div). We then request the draw passing the data we created in part 2 and created an options object to pass in as well. Note again, check the google documentation for the chart type you are using to find out what options are available.
Requirements
- LabVIEW Full Development System 2012 (or compatible)
Steps to Implement or Execute Code
- Download and unzip "Google Charts Web Service 2012 NIVerified.zip"
- Open project "Google Charts Web Service 2012 NIVerified.lvproj"
- Right click "My Web Service" under Build Specification and click Build
- After My Web Service is built, right click again and select Deploy
- Open Random "Data Web Service 2012 NIVerified.vi"
- Run the VI
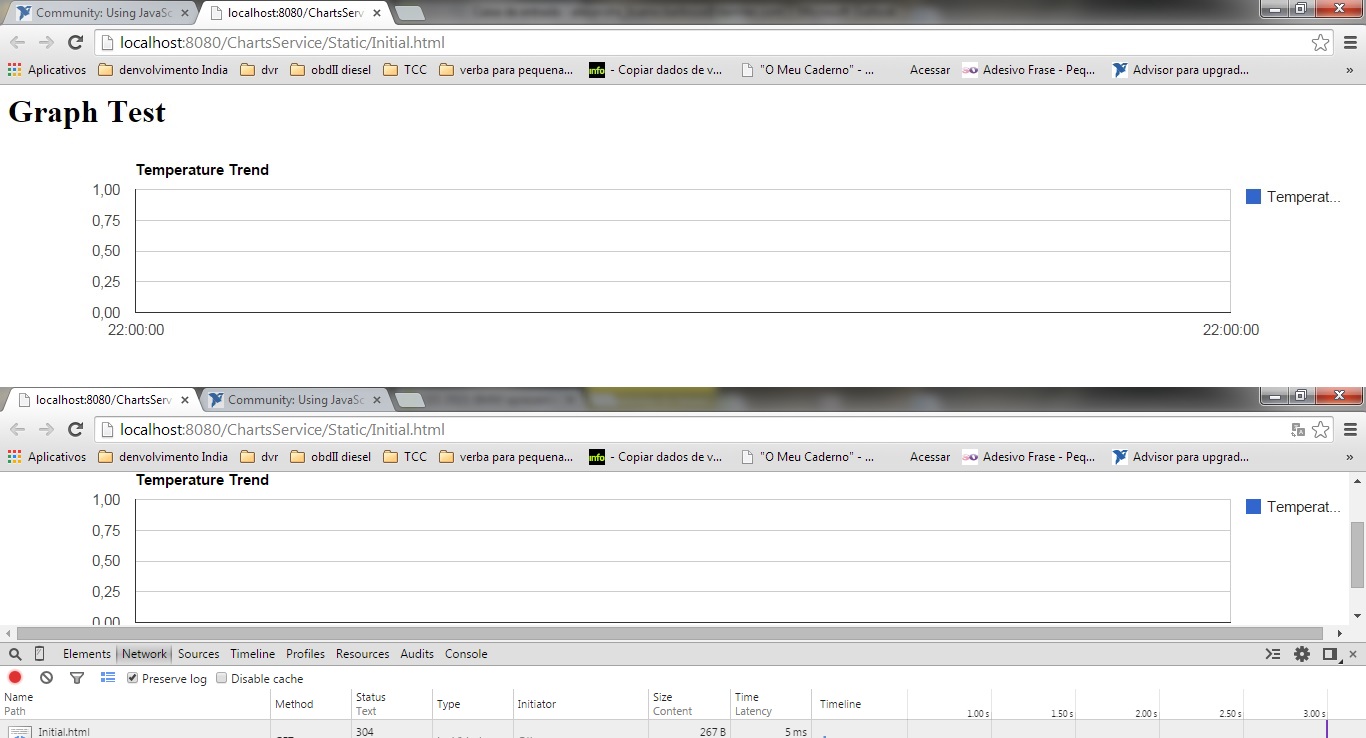
- Go to http://localhost:8080/ChartsService/Static/Initial.html to observe the generated data.
Additional Information or References
Tools Used
Beyond LabVIEW I obviously needed some specialist tools for the javascript. The ones I used are below but there maybe alternatives you prefer:
Notepad++ for editing the scripts.
Firebug for debugging the scripts.
Firefox because it is required for the full version of Firebug.
Caveats & Bugs
There appears to be a bug with the time reporting of UTC from LabVIEW Web Services so the times may be out by an hour at the moment.
Let me know if you have any questions. This is only my first time playing with JavaScript so there may be improvements or compatibility items to test but this should allow web pages that can be viewed on most devices hosted from anything running LabVIEW. Watch this space for a more fully featured example soon.
EDIT: Update display with JavaScript: Continuous Updates to Web Services with JavaScript Timers
**This document has been updated to meet the current required format for the NI Code Exchange.**
Description-Separate-2========
Ask me about Rust & NI Hardware
My writings are at https://www.wiresmithtech.com/devs/
Example code from the Example Code Exchange in the NI Community is licensed with the MIT license.
- Mark as Read
- Mark as New
- Bookmark
- Permalink
- Report to a Moderator
Nice Working...
- Mark as Read
- Mark as New
- Bookmark
- Permalink
- Report to a Moderator
Very cool Demo to show at Connectivity Course 
Applications Engineer, Japan
National Instruments
- Mark as Read
- Mark as New
- Bookmark
- Permalink
- Report to a Moderator
Excellent project
- Mark as Read
- Mark as New
- Bookmark
- Permalink
- Report to a Moderator
Very nice example.
- Mark as Read
- Mark as New
- Bookmark
- Permalink
- Report to a Moderator
excelente job!
- Mark as Read
- Mark as New
- Bookmark
- Permalink
- Report to a Moderator
Hello James, how are you?
Excellent Job but I´m trying to test it and is not working.
I built and deployed web service in build specification.
I checked if web service is running and it is.
I checked my navigator about allows javascript and its also ok.
I'm using LV2011.
 The web page appears but the values not
Could you help me?
- Mark as Read
- Mark as New
- Bookmark
- Permalink
- Report to a Moderator
Hi,
If you press F12 while on the screen the developer tools will load. At the bottom is the javascript console and this will show if there are errors in the javascript. Is there anything there?
========
Ask me about Rust & NI Hardware
My writings are at https://www.wiresmithtech.com/devs/
- Mark as Read
- Mark as New
- Bookmark
- Permalink
- Report to a Moderator
Nothing.
I have tested in 2 computers.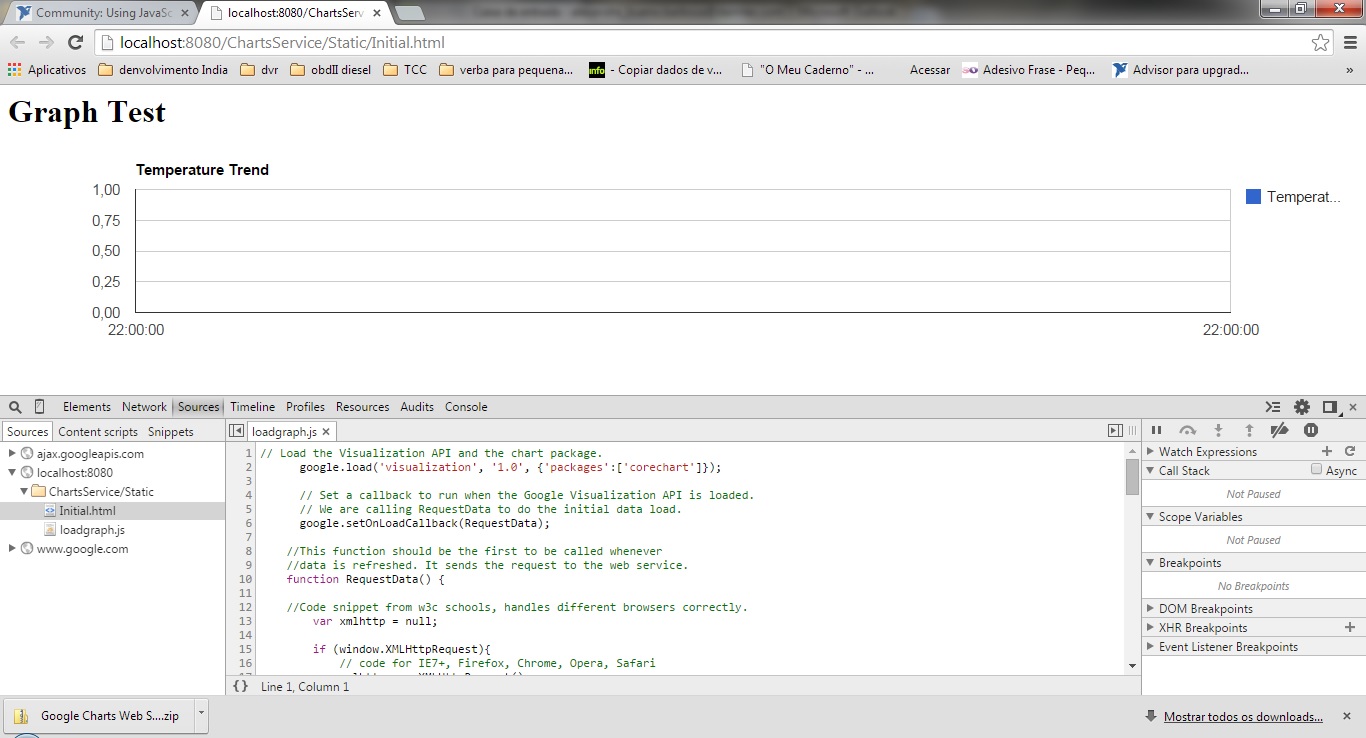
- Mark as Read
- Mark as New
- Bookmark
- Permalink
- Report to a Moderator
Hmm everything still works for me under LV2011 and latest chrome.
In your image you have the sources tab open on the developer tools. Can you be sure if you go to the console tab that is empty?
========
Ask me about Rust & NI Hardware
My writings are at https://www.wiresmithtech.com/devs/
- Mark as Read
- Mark as New
- Bookmark
- Permalink
- Report to a Moderator
Nothing.
- Mark as Read
- Mark as New
- Bookmark
- Permalink
- Report to a Moderator
The other thing to check is the network tab. This should show the call to the LabVIEW web service which is generating the data and you can see if it is returning anything or erroring out.
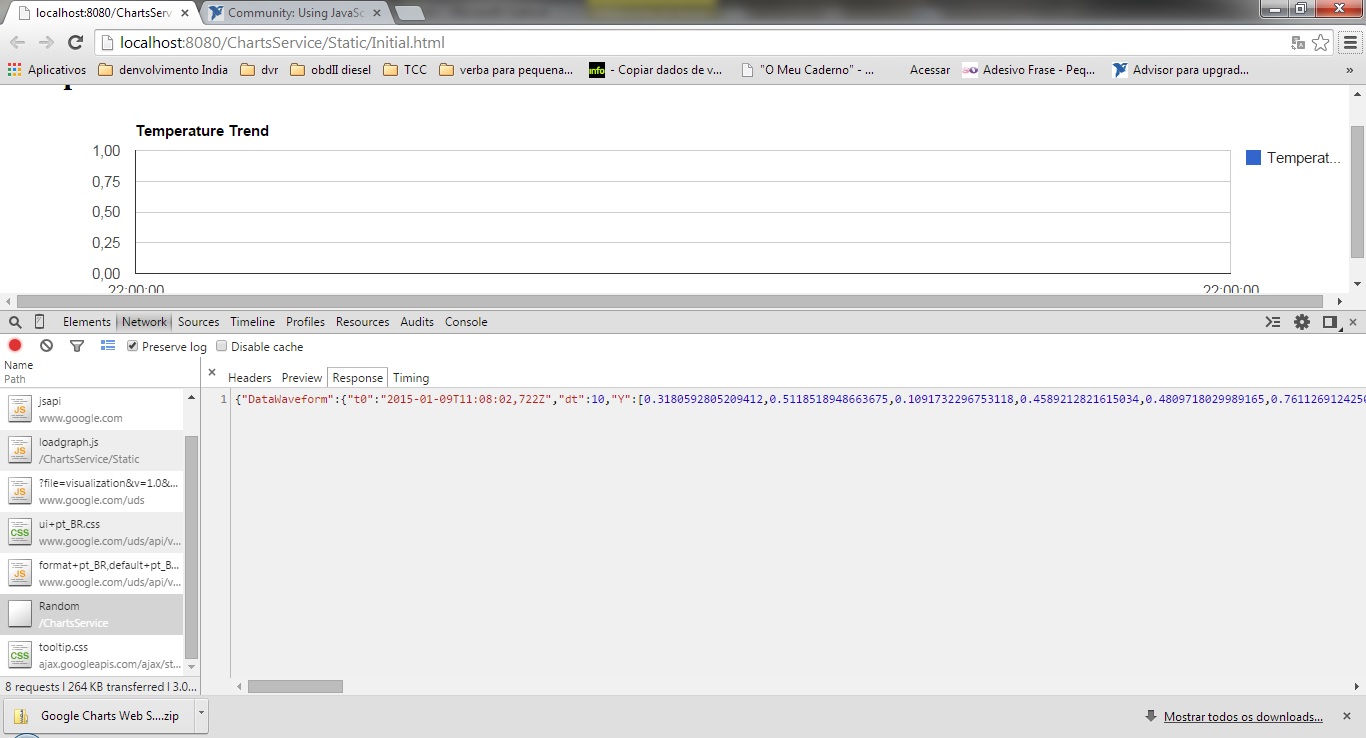
Select the network tab in the developer tools window and find the entry called random. When you click on it a new pane appears to the right. In the Headers section you want to see a response code of 200 (OK for HTTP) and in the response section you should see a JSON representation of a waveform.

========
Ask me about Rust & NI Hardware
My writings are at https://www.wiresmithtech.com/devs/
- Mark as Read
- Mark as New
- Bookmark
- Permalink
- Report to a Moderator
The code received is 200 OK and I can see data from Rando VI in the debug, but is not showed in the graph.
- Mark as Read
- Mark as New
- Bookmark
- Permalink
- Report to a Moderator
At that point I'm afraid I'm running out of key ideas. You would need to use the Javascript debugging tools to try and identify where it is failing.
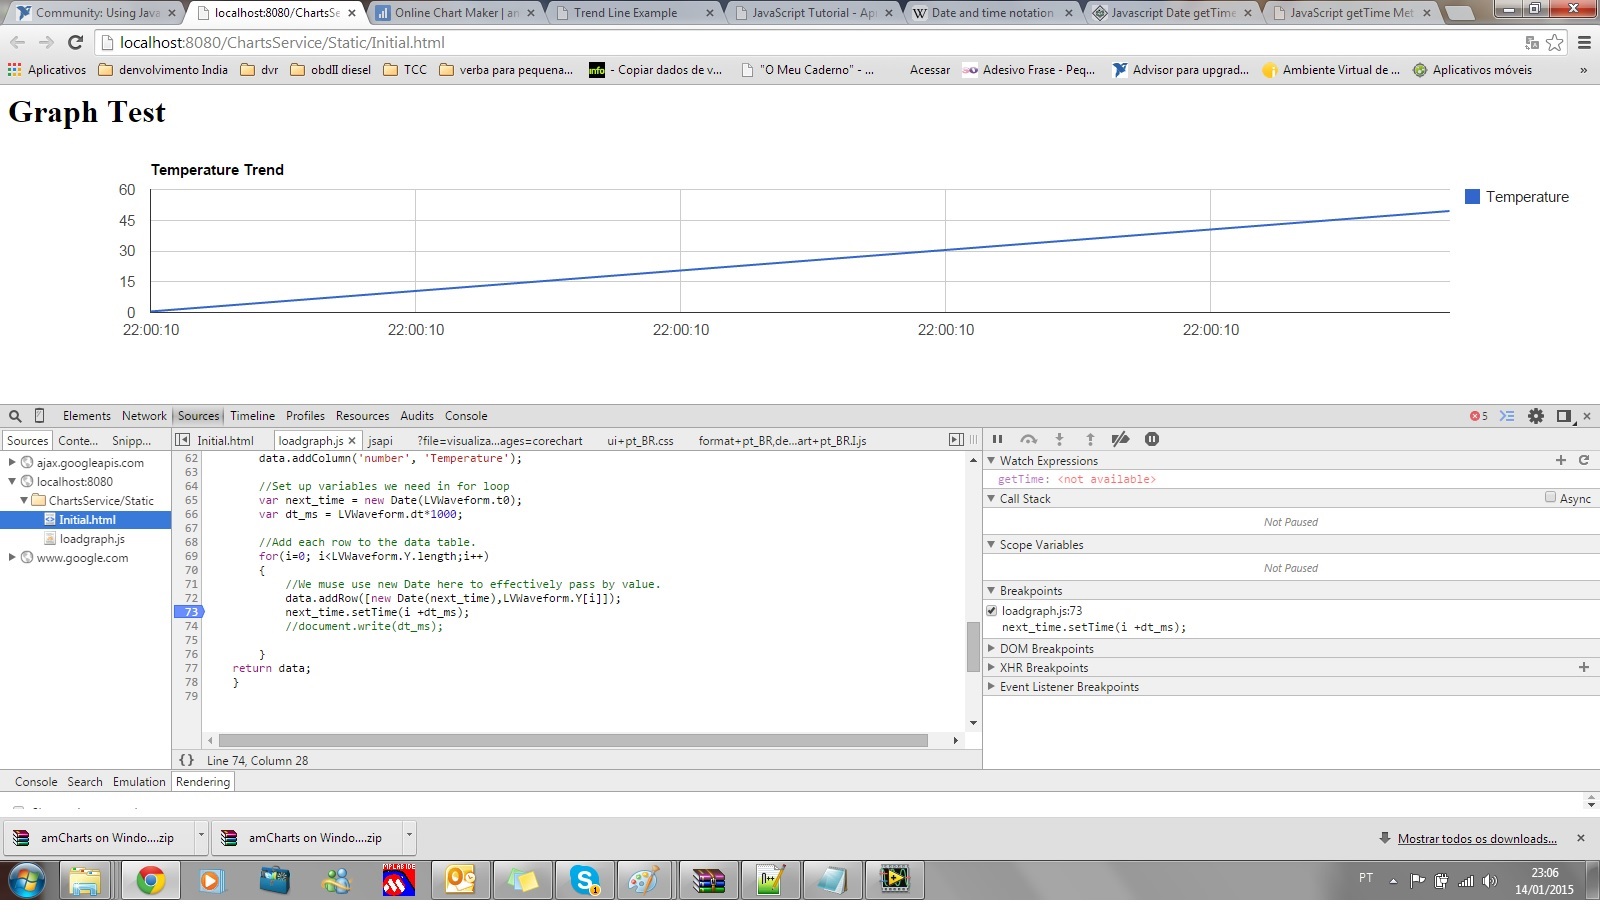
In the sources pages you can drop breakpoints and check variable values at different points of execution. Obviously as mine is working I can't really suggest anything too specific but I would probably start in the LVWaveformtoGoogleDataTable function. Make sure the data is valid at this point.
========
Ask me about Rust & NI Hardware
My writings are at https://www.wiresmithtech.com/devs/
- Mark as Read
- Mark as New
- Bookmark
- Permalink
- Report to a Moderator
{"DataWaveform":{"t0":"2015-01-09T11:27:58,169Z","dt":10,"Y":[0.2248104383182206,0.5007247911309682,0.2545030353465863,0.1639381772892434,0.5696647624915123,0.6100893355928188,0.2875071875816271,0.8335384170131965,0.981236409729058,0.1554565973159463,0.1555028333709985,0.1074254490892173,0.2945500357204642,0.9158916475182315,0.8766457554837444,0.8327727189568589,0.9666993376963518,0.2715568455853012,0.4150534386564089,0.7692608634646797,0.4032774688508487,0.575296261480315,0.9086175424600383,0.4575027034245198,0.2700792106647998,0.5554871554102657,0.8936235235378514,0.8411130999677641,0.04482604111843891,0.2350339192249282,0.4867843891284045,0.0735632126111283,0.03522635815077635,0.3760026448445528,0.7683512487484778,0.6599877603035482,0.5298068788534116,0.322411842845695,0.8792767540442048,0.04383892613381768,0.6846530292712945,0.5300168913529542,0.1498576615479483,0.2677147532996442,0.1813225578318636,0.8469294201602331,0.9724627688136308,0.5728667363084539,0.4796078279764713,0.7655522079622332,0.1666086537887961,0.02364800535281697,0.5489985691446573,0.1192305432779741,0.8854704925062769,0.9103112775342186,0.2327533406488493,0.9579269798016624,0.6281144341823515,0.9655604466570265,0.0942012946117412,0.7272516127737694,0.4098144195405271,0.5099319744747186,0.008525329107530677,0.6111083781488929,0.9093305903599642,0.8239956953862149,0.7468237660446115,0.89522474665868,0.8126489602591679,0.6868639196007775,0.7113821659548714,0.169550164969184,0.1854334071036996,0.1328274117910637,0.1579768166272824,0.6087445757579775,0.6157109754041008,0.9702648176205191,0.5762399584212783,0.5462268821101481,0.1914531912212583,0.9426393585484496,0.1767766488789675,0.09084422734507536,0.9002122567996235,0.08703736591522615,0.001072207777568224,0.7507181632873081,0.3732778692417231,0.07460318417520062,0.4353509314078154,0.2718289809668484,0.498865649048385,0.6072859217211466,0.8232055011120467,0.1686647348168546,0.1920830116764694,0.3644976635488739],"error":{"status":false,"code":0,"source":""}}}
This is the data from VI
Is there anything wrong?
- Mark as Read
- Mark as New
- Bookmark
- Permalink
- Report to a Moderator
this looks exactly as I would expect so the error must be in the javascript somewhere. I notice that you have different localisation settings e.g. for decimal points. I think JSON should cope with that though.
By putting a breakpoint in the function I mentioned before you can see the javascript representation of the LVWaveform and make sure it is correctly interpreted. See https://developer.chrome.com/devtools/docs/javascript-debugging for details on using the debugging tools in chrome.
========
Ask me about Rust & NI Hardware
My writings are at https://www.wiresmithtech.com/devs/
- Mark as Read
- Mark as New
- Bookmark
- Permalink
- Report to a Moderator
Hello again James.
After a lot of debugging and some learning about JavaScript I found the problem.
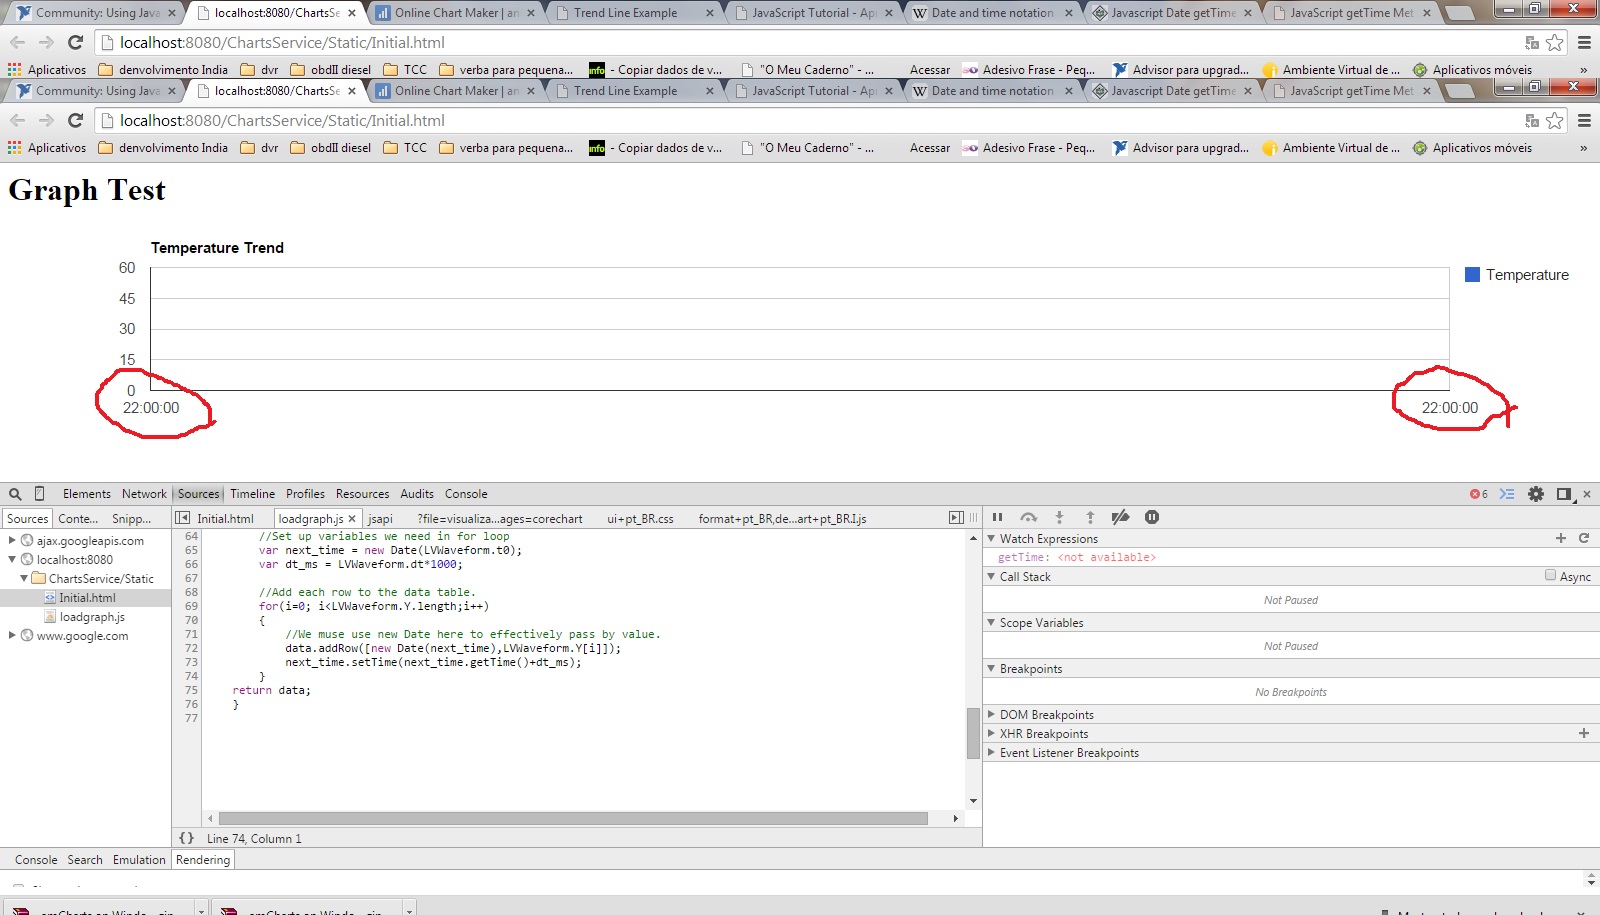
I dont know why the line "next_time.setTime(next_time.getTime()+dt_ms);" is returning date invalid.
I put the variable "i" to replace time and I can see the graph.
I dont know how to solve it.
thank you!!!

- Mark as Read
- Mark as New
- Bookmark
- Permalink
- Report to a Moderator
Could you guys please help me to find out the problem and give me the best solution for this one?
I am trying to draw a chart using google chart for my project, but I cannot draw it, it seems my "datatable" which has the problem with adding the rows. However, I am not sure where is the problem and I do not know how to fix it. I try many different ways to fix it, but it is not successfully. I am just a new one with Labview and google chart. Please help me. Thank you so much.
1. Here, the code in Labview.

2. Javascript

3. HTML

4. And I only can show the data to a web page like this, but no chart. The data changes all the time, and I need to draw the chart that is corresponding to the data at that time.

