- Subscribe to RSS Feed
- Mark Topic as New
- Mark Topic as Read
- Float this Topic for Current User
- Bookmark
- Subscribe
- Mute
- Printer Friendly Page
XY graph to Excel spreadsheet
08-12-2008 08:17 AM
- Mark as New
- Bookmark
- Subscribe
- Mute
- Subscribe to RSS Feed
- Permalink
- Report to a Moderator
Thanks in advance.
08-12-2008 08:28 AM - edited 08-12-2008 08:28 AM
- Mark as New
- Bookmark
- Subscribe
- Mute
- Subscribe to RSS Feed
- Permalink
- Report to a Moderator
Greetings, Christian
Message Edited by cschneider on 08-12-2008 04:28 PM
THINK G!! 😉
------------------------------------------------------------------------------------------------
Using LabView 2010 and 2011 on Mac and Win
Programming in Microsoft Visual C++ (Win), XCode (Mac)
08-12-2008 08:29 AM
- Mark as New
- Bookmark
- Subscribe
- Mute
- Subscribe to RSS Feed
- Permalink
- Report to a Moderator
08-12-2008 08:52 AM
- Mark as New
- Bookmark
- Subscribe
- Mute
- Subscribe to RSS Feed
- Permalink
- Report to a Moderator
Thanks.
08-12-2008 09:04 AM - edited 08-12-2008 09:05 AM
- Mark as New
- Bookmark
- Subscribe
- Mute
- Subscribe to RSS Feed
- Permalink
- Report to a Moderator
Instead of us guessing how you created the XY Graph, you should post your code. My guess is that it is a simple bundle of an x array and a y array. You just have to do the opposite in order to create the 2D array you want to write.
For learning these LabVIEW basics, you have available the tutorials at http://www.ni.com/academic/lv_training/how_learn_lv.htm.
Message Edited by Dennis Knutson on 08-12-2008 08:05 AM
08-12-2008 09:05 AM
- Mark as New
- Bookmark
- Subscribe
- Mute
- Subscribe to RSS Feed
- Permalink
- Report to a Moderator
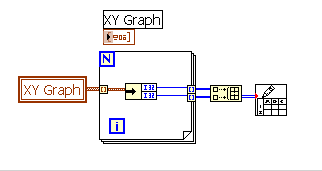
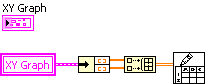
Hi lefterisa,
see the attached picture please. That´s what i understand what you want.
Hope it helps.
Mike
08-12-2008 09:08 AM
- Mark as New
- Bookmark
- Subscribe
- Mute
- Subscribe to RSS Feed
- Permalink
- Report to a Moderator
08-12-2008 09:10 AM
- Mark as New
- Bookmark
- Subscribe
- Mute
- Subscribe to RSS Feed
- Permalink
- Report to a Moderator
08-12-2008 09:22 AM
- Mark as New
- Bookmark
- Subscribe
- Mute
- Subscribe to RSS Feed
- Permalink
- Report to a Moderator
Thanks
08-12-2008 09:31 AM
- Mark as New
- Bookmark
- Subscribe
- Mute
- Subscribe to RSS Feed
- Permalink
- Report to a Moderator
You have an array of clusters. This is due to you using the fandangled BuildXY Graph Express VI. I hate express VIs. Regardless, are you plotting multiple graphs? If so, then you first need to decide how to save the data. Do you want a separate file for each graph, or additional columns? If you're plotting just one graph then simply insert an Index Array function between your XY Graph local variable and the for-loop.
