- Subscribe to RSS Feed
- Mark Topic as New
- Mark Topic as Read
- Float this Topic for Current User
- Bookmark
- Subscribe
- Mute
- Printer Friendly Page
Desktop Execution Trace Toolkit points to an Unbundle by name for a reference leak
09-15-2010 02:51 PM
- Mark as New
- Bookmark
- Subscribe
- Mute
- Subscribe to RSS Feed
- Permalink
- Report to a Moderator
Hi,
I have been using Desktop Execution Trace Toolkit 2009 to debug an application. We have been able to locate most of the reference leaks and fixed them. However, there is a reference leak that when I double click on the Execution Trace Toolkit line points to an Unbundle by name
The other times I got a reference leak, it would point to a place where a reference would actually get created such as Obtain Queue, Obtain Semaphore, etc.
Any idea why it is pointing to an Unbundle by name function?, also the event details are "VI: 0xD8300076", but I can not find that reference anywhere else in the trace report.
Thanks,
Fabiola
Check out DSH Pragmatic Software Development Workshop!
DQMH Lead Architect * DQMH Trusted Advisor * Certified LabVIEW Architect * Certified LabVIEW Embedded Developer * Certified Professional Instructor * LabVIEW Champion * Code Janitor
Have you been nice to future you?
09-22-2010 05:55 PM
- Mark as New
- Bookmark
- Subscribe
- Mute
- Subscribe to RSS Feed
- Permalink
- Report to a Moderator
Fabiola:
Is there a chance you could post a screen shot of the Desktop Execution Trace (DET) output? Also, what do you have included in the cluster (i.e. what are we unbundling from)?
National Instruments | http://www.ni.com/support
09-23-2010 04:08 PM
- Mark as New
- Bookmark
- Subscribe
- Mute
- Subscribe to RSS Feed
- Permalink
- Report to a Moderator
Caleb,
I am attaching the DET image of the line that shows the Reference Leak. When I double click on that line it points to the Unbundle by name.
I did a snippet of only that piece of code. It is obtaining information regarding all the monitors in the computer and from there it unbundles the Bounds information.
Now, the question would be how does DET determine the location in a block diagram for a reference leak. Up until this point, I thought it pointed to where the reference was created. I don't understand why it is pointing to an "Unbundle by name". As far as I know that function does not create a reference, does it? Can you check with the R&D group in charge of DET when/why DET would point to Unbundle by name to show a reference leak?
When I build an executable of my application and I do a new trace on the stand alone application, DET does not report that reference leak anymore. But it consistently reports it when the application is ran in the development environment.
Fab
Check out DSH Pragmatic Software Development Workshop!
DQMH Lead Architect * DQMH Trusted Advisor * Certified LabVIEW Architect * Certified LabVIEW Embedded Developer * Certified Professional Instructor * LabVIEW Champion * Code Janitor
Have you been nice to future you?
09-24-2010 11:33 AM
- Mark as New
- Bookmark
- Subscribe
- Mute
- Subscribe to RSS Feed
- Permalink
- Report to a Moderator
Fabiola:
I think I was zoomed in a bit too far (as the DETT may have been). It looks like the application reference created by the property node isn't closed. Try this:
National Instruments | http://www.ni.com/support
09-24-2010 04:51 PM
- Mark as New
- Bookmark
- Subscribe
- Mute
- Subscribe to RSS Feed
- Permalink
- Report to a Moderator
Caleb,
Yes, my code does include the close reference VI you circled in red.
Note that if I run this snippet without the 'close reference', the DETT does not show any reference leak. I would expect it to show me a reference leak at the property node, which is where the reference is created. This is based on every other reference leak I have seen when using when the DETT. For example, if a queue is not closed/released, the DETT does not point at the last use of the queue -- it points to where the queue was created.
So, my original question still remains: Can you please check with the DETT development team to see if there is a case where a reference leak would NOT point to where the reference is created? As far as I understand the DETT, this is not the expected behavior.
Thanks again for your help!
Fabiola
Check out DSH Pragmatic Software Development Workshop!
DQMH Lead Architect * DQMH Trusted Advisor * Certified LabVIEW Architect * Certified LabVIEW Embedded Developer * Certified Professional Instructor * LabVIEW Champion * Code Janitor
Have you been nice to future you?
09-27-2010 01:42 PM
- Mark as New
- Bookmark
- Subscribe
- Mute
- Subscribe to RSS Feed
- Permalink
- Report to a Moderator
Since this is an application-specific issue could you attach an expanded screen shot of your block diagram with some more context around the snippet? That will hopefully give us a better idea of why the toolkit is going to the "unbundle by name" function for the reference leak, and hopefully give us a better idea of what could be affecting the VI at that level.
The behavior of the compiled EXE is due to the logic the compiler uses to determine if a reference is going to be needed later on in the VI (in the EXE the reference is likely being auto-closed).
It's interesting that the DETT doesn't list the leak on that snippet. Is that particular portion of the code in a loop in your main VI? That may affect it. Again, if you'd be willling to attach a screen shot, I can definitely give you a better idea of what's going on with that particular piece of code.
National Instruments | http://www.ni.com/support
09-27-2010 04:26 PM
- Mark as New
- Bookmark
- Subscribe
- Mute
- Subscribe to RSS Feed
- Permalink
- Report to a Moderator
Caleb,
I did a simple queue example to illustrate what the Desktop Execution Trace Toolkit does when there are reference leaks.
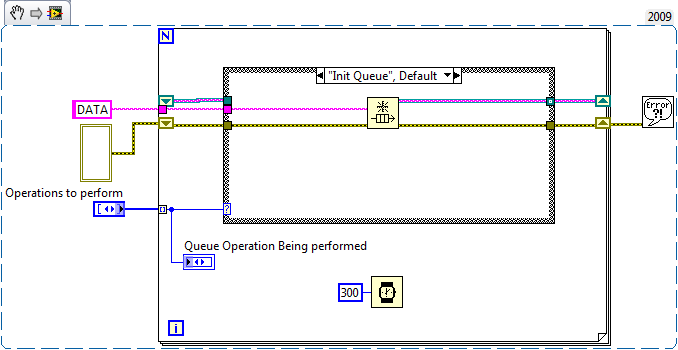
The following snippet (if ran using the default values) will initialize the Queue, Enqueue an element, Dequeue an element, Release the queue and exit.
1) Drag this snippet to an empty Block Diagram, then assuming you have Desktop Execution Trace Toolkit installed, go to the menu Tools>>Profile>>Trace Execution. This will open a DETT session.
2) Click on the Start button inside the DETT.
3) Run the VI.
4) When it completes execution, click on the Stop button inside the DETT.
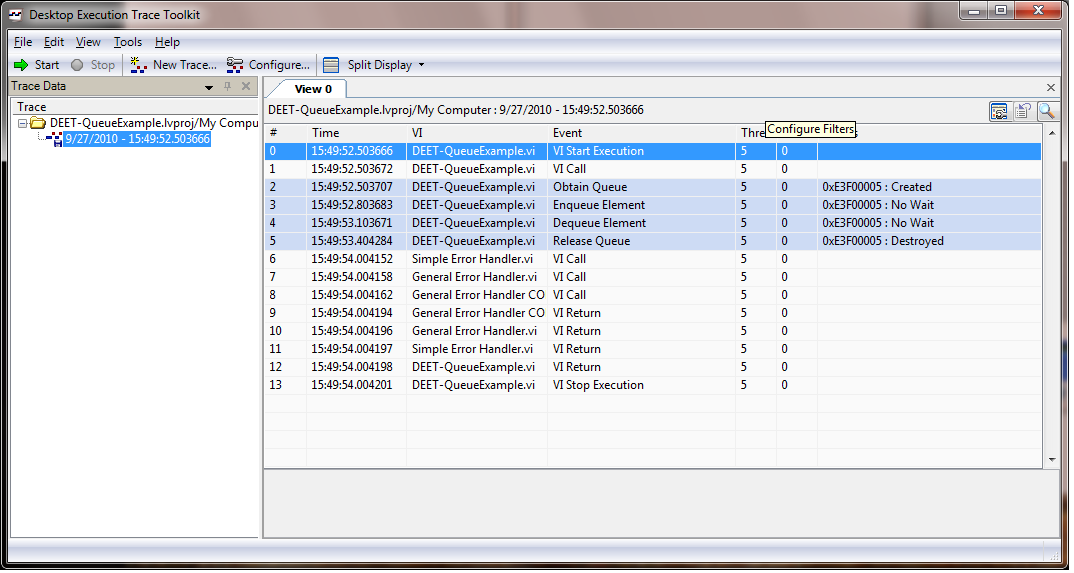
This trace will NOT show any reference leaks, because we did release the queue. You will see a trace similar to this:
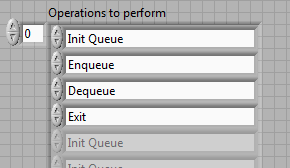
5) Now, if you remove the step "Release Queue" from the array on the front panel:
6) Click on New Trace button inside DETT.
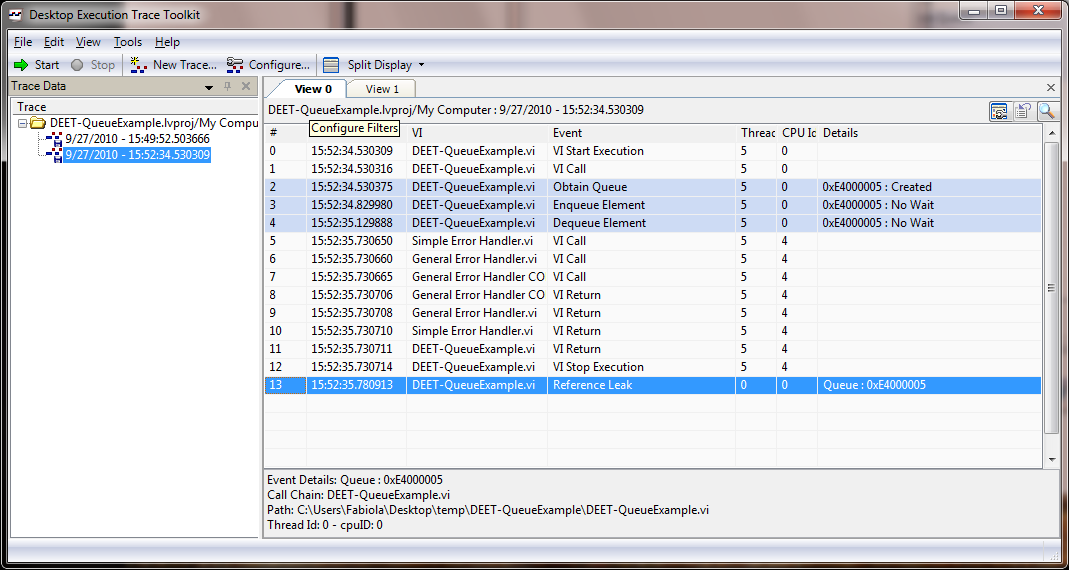
7) Repeat steps 2 to 4. This time there will be a reference leak, because the code to release the queue was never executed. You will obtain a trace similar to this:
😎 Double click on the line where the Reference Leak is indicated (in this case line 13 of the Trace).
9) The DETT will show you on the block diagram of your VI the "Obtain Queue", this is the place where the reference was created.
Note that the DETT points to where the reference was created. It does not point to the place where it was last used, or where it should be closed. It shows you where it was created. As a developer, you know that the Release Queue would close that reference. And you know you have that code in your block diagram, now you will use this information to troubleshoot and figure out that the Release Queue never executed.
Now, I will go ahead and do a similar example with the original snippet. I will post it in a little bit.
Fab
Check out DSH Pragmatic Software Development Workshop!
DQMH Lead Architect * DQMH Trusted Advisor * Certified LabVIEW Architect * Certified LabVIEW Embedded Developer * Certified Professional Instructor * LabVIEW Champion * Code Janitor
Have you been nice to future you?
09-27-2010 04:44 PM
- Mark as New
- Bookmark
- Subscribe
- Mute
- Subscribe to RSS Feed
- Permalink
- Report to a Moderator
Caleb,
If I run a trace on the following code:
I obtain the following:
If I delete the close reference:
I obtain the following trace:
Notice how there are no reference leaks. I believe this is because the reference in question would be the application in this case LabVIEW in the Development environment.
So the original question still remains. In which instance would the DET point to an unbundle by name to indicate a reference leak? This does not seem like an expected behavior, based on the queue example I posted earlier. Also, you can see that the function used is pointing to the LabVIEW application and that does not show as a reference leak when ran by itself.
I will send you via a private message the image you requested for the code where the DET is pointing to the Unbundle by name. But I would still want to know: In which instance would the DET point to an unbundle by name to indicate a reference leak?
Thanks,
Fab
Check out DSH Pragmatic Software Development Workshop!
DQMH Lead Architect * DQMH Trusted Advisor * Certified LabVIEW Architect * Certified LabVIEW Embedded Developer * Certified Professional Instructor * LabVIEW Champion * Code Janitor
Have you been nice to future you?


