- Subscribe to RSS Feed
- Mark Topic as New
- Mark Topic as Read
- Float this Topic for Current User
- Bookmark
- Subscribe
- Mute
- Printer Friendly Page
Graph axis configuration during acquisition
09-26-2007 07:02 AM
- Mark as New
- Bookmark
- Subscribe
- Mute
- Subscribe to RSS Feed
- Permalink
- Report to a Moderator
I have a simple question, that is not-so-easy to solve apparently. In two words, here is what I want to do :
1) I have a laser providing a voltage (analogic signal), acquisition with a DAQmx card.
2) I developed a simple application that acquires the signal, writes it into a LVM file. This works fine.
3) I added a sliding graph to visualize DURING 30s the evolution of the time over time (the voltage measuring tremor).
The problem is: I cannot configure my sliding graph in order that it begins on the left of the graph, and finishes ont the right of the graph. Simple, isn't it? But in fact, as long as the X-axis is composed of some strange stuff that is always dependant of the time of the system (hour, seconds and so on), so sometimes my signal appears at the beginning of the acquisiton somewhere between the two extremes of the graph. What I would like simply is: min value of x = 0, max value of x = 30s, and visualize continuously my signal over time from the left to the right of the graph. I tried to configure the mi/max value in the graph options, but this did not work.
I'm pretty sure that there is a simple way to do this, but I do not know it !
If anyone can help me, I'd appreciate it !! 😉
Julien
09-26-2007 07:10 AM
- Mark as New
- Bookmark
- Subscribe
- Mute
- Subscribe to RSS Feed
- Permalink
- Report to a Moderator
very fast solution:
right mouse on the graph -> ignore time stamp
more elaborate solution:
on the block diagram, get waveform components, extract y and dt, make a x array, bundle, and display in a x-y graph
best solution: (i like most):
aquire a 1D double instead of a waveform. gives most versatility.
... And here's where I keep assorted lengths of wires...
09-26-2007 11:01 AM - edited 09-26-2007 11:01 AM
- Mark as New
- Bookmark
- Subscribe
- Mute
- Subscribe to RSS Feed
- Permalink
- Report to a Moderator
http://img113.imageshack.us/my.php?image=labviewvm7.png
However, there is an evolution only over the Y-axis (signal from the laser), and it stays at x=0... How could I solve it please?
Thank you very much by advance,
Julien
Message Edité par Julianito le 09-26-2007 11:02 AM
09-26-2007 05:33 PM
- Mark as New
- Bookmark
- Subscribe
- Mute
- Subscribe to RSS Feed
- Permalink
- Report to a Moderator
... And here's where I keep assorted lengths of wires...
09-27-2007 04:30 AM
- Mark as New
- Bookmark
- Subscribe
- Mute
- Subscribe to RSS Feed
- Permalink
- Report to a Moderator
Thank you again for your answer. However, this is not completely clear for me. So what I did to simplify things:
1) I still use a DAQ assistant to acquire data under dynamical data format, 10 samples to read, 100 Hz.
2) I use now a classical graph, in which I have the option to ignore time stamp (this option was not in the sliding graph, except in the Properties panel, and was not kept in memory from one trial to another).
3) As I have chosed the option “ignore time stamp” onmy classical graph, I have my x-scale OK from 0 to 30s. My Y-scale is OK also.
4) The acquisition works fine.
BUT : I see the signal evolution only from x=0 to x=0.1 (I think that this is related to 10 samples to read/100 Hz), repeating again and again, and only in this range. How can I do in order to obtain a CONTINUOUS evolution from 0 to 30 and not only in this very small range?
Thank you again VERY much for your help, which is HIGHLY appreciated.
Julien
09-27-2007 05:57 AM - edited 09-27-2007 05:57 AM
- Mark as New
- Bookmark
- Subscribe
- Mute
- Subscribe to RSS Feed
- Permalink
- Report to a Moderator

Message Edited by Gabi1 on 09-27-2007 12:57 PM
... And here's where I keep assorted lengths of wires...
09-28-2007 09:20 AM - edited 09-28-2007 09:20 AM
- Mark as New
- Bookmark
- Subscribe
- Mute
- Subscribe to RSS Feed
- Permalink
- Report to a Moderator
First, thank you one more time for your time. I had some trouble with this so I tried something that ALMOST works !! Here is it attached.
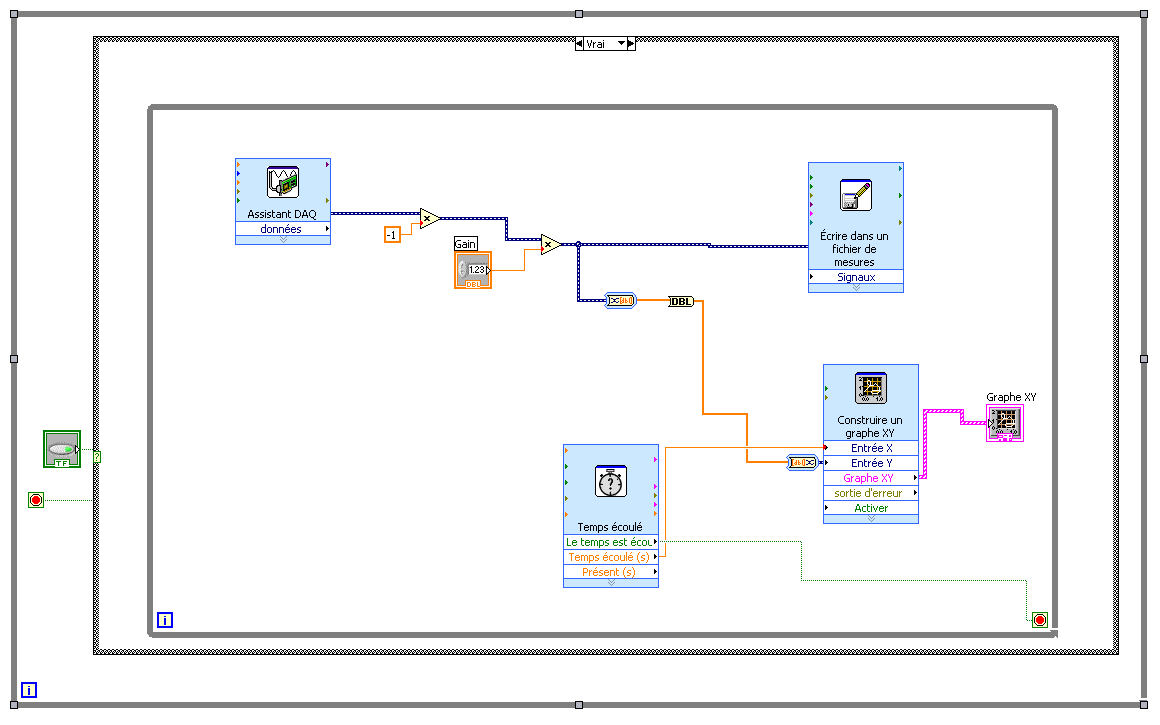
I Have a continuous evolution of the signal from 0 to 30s, and all I wanted is now perfect 🐵 I inspired from your solution to use a XY graph. BUT there is still a problem: there is an increasing delay between the signal and its display, i.e., when there is some tremor measured with the laser it displays about 3-4 seconds on the graph, and it displays more 10s after when the software runs for about 20s.... So it appears that there is an increasing delay between what happens and what is displayed. I recall that my data is acquired with N samples (10) at a frequency of 100 Hz.
What could cause this last problem? I'm pretty sure that it's about the XY graph which should be in a separate loop or something like that... (but remember that I want to display the signal instantaneously and continuously)
Thank you again in advance 🙂
Julien
Message Edité par Julianito le 09-28-2007 09:21 AM
Message Edité par Julianito le 09-28-2007 09:22 AM
09-28-2007 10:07 AM
- Mark as New
- Bookmark
- Subscribe
- Mute
- Subscribe to RSS Feed
- Permalink
- Report to a Moderator
there are a few things which strikes me as wrong in this picture:
1) you transfer from dynamic data type to 1D double array. then from double to double. then from 1D double to dynamic data type. why?
2) the idea of an xy graph is that for each y point you also have a x point. in this vi, for each array of y you give a single x point. what you will get is a list of (in your case 10) y points for each x position.
i think for now, try to stick to the waveform idea, since you do not have such x array, but have the interval value dt.
how to do:
- transfer from dynamic data type to waveform and decompose into Y array and dt. insert the y array into a bigger 1D array, updated using a shift register as shown before.
- take the outcoming big 1D array, and recompose into a waveform. update dt from before. display in a waveform graph.
should be ok.
... And here's where I keep assorted lengths of wires...
09-28-2007 10:21 AM
- Mark as New
- Bookmark
- Subscribe
- Mute
- Subscribe to RSS Feed
- Permalink
- Report to a Moderator
Then, I do not see what you mean by "update dt from before" :-s Could you please draw a quick thing based on my graph?
Thank you again...
Julien
09-28-2007 01:26 PM
- Mark as New
- Bookmark
- Subscribe
- Mute
- Subscribe to RSS Feed
- Permalink
- Report to a Moderator
this is called a shift register. you need to pass trough Labview basics i think.
right click on the while loop, and press "add shift register". to this you can wire from inside the while loop any data to the right, and it will be available at the next iteration of the loop on the left side. this register is a way to update a value or array during loop iterations.
at first iteration this shift register generally requires initialisation (initial value, which in your case would best be an empty array).
now in the loop, what happens is you take this array, and append to it the data you just aquired with the card. you cannot append dynamic data, and thats why you need to decompose and get the 1D array.
then you take the whole array and display it in a graph. since you do know the interval between the y points, it is just natural to use a waveform graph. for that you need to compose the waveform from the y array, and the dt (time interval).
every iteration of the loop, the whole array gets updated with the appended new data, displayed in the graph, and passed trough the shift register to the next iteration.
try to look how it is done with my figure, and reproduce it in your system.
post your vi, and we can also work from there.
... And here's where I keep assorted lengths of wires...
