LabVIEW

cancel
Showing results for 
Search instead for 
Did you mean: 

Curve fitting of two equations to one curve

I have a set of x and y values, I have to fit two seperate equations to the data points, the first equation is valid for 0<=x<=30, the second equation is valid for x=>30, the two equation have two constants a and b and consist of exponential intergrals, I need to fit the continuous curve and work out the a and b constants.  y1=-(1/a)*Ei(-1/bx), y2=-(1/a)*(Ei((-1/bx)+Ei(-1(x-30))), Can anyone please lead me in the right direction? Sample code will be great! 
0 Kudos
Message 1 of 10
(4,407 Views)
I am confused in several ways here:
 
The exponential integral function in LabVIEW only works for positive inputs, so why all these -1's???
 
What are typical values for a and b (e.g. are they negative or positive?)
What is the correct value for "n" of the exponential integral function?
What is the typical range of x (xmin, xmax)?
 
You do not define which function to use for x=30 (it is included in both ranges!).
You do not define what should happen for x<0
 
Do you have LabVIEW 8.0 or higher? Depending how well behaved the function is, the nonlinear curve fit might work just fine. Simply define you function for continuous X and switch algorithms inside the model depending on the actual x value for each point.
 
I made a simple skeleton code for the model function. once you give me the valid and typical ranges above, I can test it. 🙂
Message 2 of 10
(4,372 Views)
Let me start again, I have simplified the formulae so it only contains exponential intergral of +ve numbers. 
 
y=(1/a)*Ei(1/bx), for 0<=x<=30 
y=(1/a)*(Ei((1/bx)-Ei((1/b)/(x-30))), for x>30 
 
n=1 in Exponential intergral
 
a is approximately = 0.1377
b is approximately = 0.0144
 
See below for the x and y data points, at x=0, y=0, and there are no points for x<0.  I hope this helps.
 
0 Kudos
Message 3 of 10
(4,358 Views)
0 Kudos
Message 4 of 10
(4,358 Views)
I forgot to mention, we only have Labview 7.1.
0 Kudos
Message 5 of 10
(4,357 Views)
OK, I think your formulas are still messed up a bit. I get a pretty good fit using:
 
y=(1/a) * Ei(1/(bx)), for x<=30
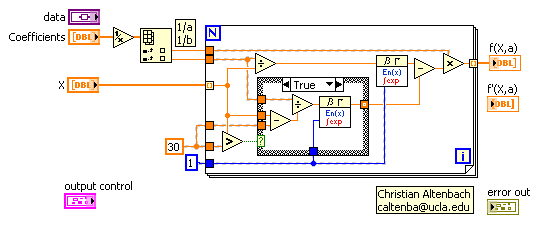
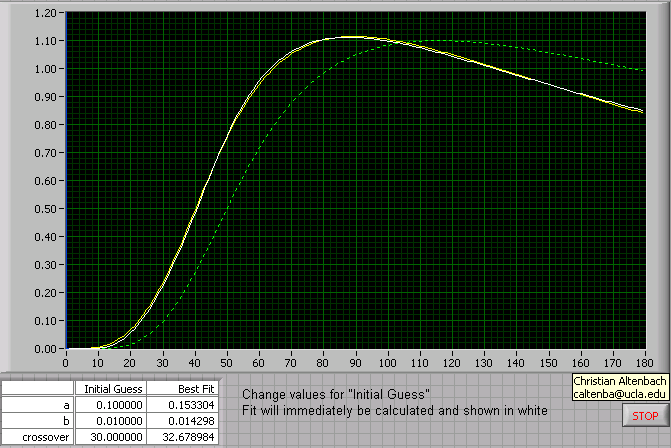
y=(1/a) * {Ei(1/(bx)) - Ei((1/b)/(x-30))}, for x>30
 
Here's a picture of my "model" code (ignore the dashed wires, they indicate constant folding in 8.20):
 
Using the LabVIEW 8.20 version of "Nonlinear Cure Fit" (Lev-Mar: VI model).
 
I get a=0.136867, b=0.013798 for a wide range of reasonable starting values (e.g. a, b =0.001...1.000). Now, the problem would be to translate this to 7.1, which only has the ancient, much less functional Lev-Mar. This is not easy. (I might have some old alternative VIs that might do the job).
 
Here's a typical output:


Message Edited by altenbach on 10-24-2006 11:22 PM

Download All
Message 6 of 10
(4,340 Views)
I have tried to get this working in 7.1, see below.  Ei fit.vi is the main vi.  You might be able to help me, I'm finding it hard to locate where I have gone wrong. 
0 Kudos
Message 7 of 10
(4,296 Views)
0 Kudos
Message 8 of 10
(4,295 Views)
The main problem with your version is the fact that you did not change the function calls within the subVIs "Lev-mar ABX" and "Lev-mar XX", both inside "Nonlinear Lev-Mar fit(D)". You're calculating the alpha matrix, beta vector, and chisquare with a different model function!!!
 
The need for all these modifications makes the LabVIEW 7.1 version so tedious and the 8.0+ version so much better. The model calculation looks OK (except for a lot of duplicate code in the two cases of the case structure). But still you should always also graph the model calculated with the initial guesses to see if you're even close.
 
Long ago I modified the old Lev-Mar fitting subroutines to:
  • Call the model function by reference so the fitting VI's don't need to be rewritten for each model.
  • Make the model function work on arrays of x instead of one x at a time. This allows much more flexibility for the model.

As I mentioned, the LabVIEW 8.0+ fitting routines implement the above, and much more. If you get a change to upgrade, do it. 😉

Attached is a quick modification where I downconverted the 8.20 version mentioned in an earlier post to 7.1 and patched in my old fitting routines. They seem to work OK.

See how far you get and let me know if you have any questions. 🙂

Message Edited by altenbach on 10-27-2006 01:21 AM

Message 9 of 10
(4,282 Views)
Of course you could easily change the crossover point (now fixed at 30) to a fittable parameter.
 
The three paramter fit tells us that a value of 32.7 instead of 30 gives a significant improvement (by about ~35%).


Message Edited by altenbach on 10-27-2006 02:28 PM

Message 10 of 10
(4,251 Views)