- Subscribe to RSS Feed
- Mark Topic as New
- Mark Topic as Read
- Float this Topic for Current User
- Bookmark
- Subscribe
- Mute
- Printer Friendly Page
Export multiple xy graphs to same ACII text file
10-05-2018 09:25 AM
- Mark as New
- Bookmark
- Subscribe
- Mute
- Subscribe to RSS Feed
- Permalink
- Report to a Moderator
Hello,
I have xy graph data for emission spectra (an intensity value for every corresponding wavelength) in the form of "1D array of cluster of 2 elements"(first wavelength then intensity I reckon). The problem is that I can only acquire the data up to a certain wavelength, then I have to move the grating and do the next measurement.This way every xy graph starts right after the wavelength where the last one left off.
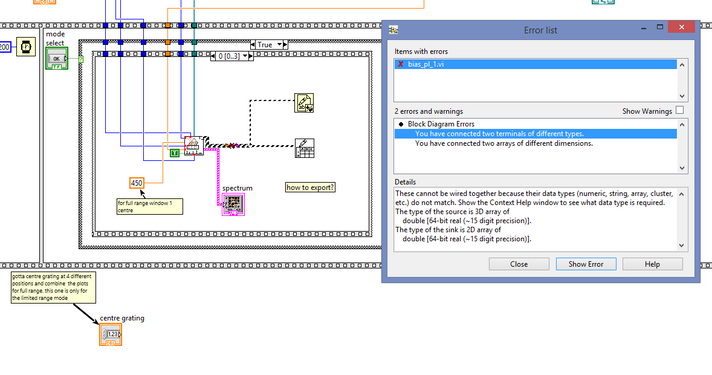
What I wanted to do but failed are two things. I want to get the data exported to a space delimited ASCII text file in two columns, so that they can be later plotted in Excel or Origin and I also want to write the second measurement at the end of same file. To control the spectrometer CCD Camera I am using a VI I found on the forums and that works as is but my problem is that the "write to spreadsheet" or "write to text" functions I tried using do not work with this type of data.
I also attached the VI and a zipped folder with all the other sub VIs.
10-05-2018 10:09 AM
- Mark as New
- Bookmark
- Subscribe
- Mute
- Subscribe to RSS Feed
- Permalink
- Report to a Moderator
I would recommend tab delimited, instead of space delimited.
All you need to do is (1) write the header, (2) Write the data, appending to the current file. At the moment, you have a 3D array, so you probably should reshape it to a 2D array with the desired columns.
Can you simplify it sufficiently for us, e.g. run the VI so the 3D array contains data, create a 3D array diagram constant with typical data (run to acquire, stop, right-click...create constant), place that into a new VI and attach it here.
(Most of the rest of the code is not interesting to solve the problem, it also contains way too many sequences for my taste. :D)


