- Subscribe to RSS Feed
- Mark Topic as New
- Mark Topic as Read
- Float this Topic for Current User
- Bookmark
- Subscribe
- Mute
- Printer Friendly Page
Debugging FlexLogger Plug-Ins - Reentrant Clone Block Diagram
11-09-2022 11:43 PM
- Mark as New
- Bookmark
- Subscribe
- Mute
- Subscribe to RSS Feed
- Permalink
- Report to a Moderator
Trying to debug a plug-in with hardware in the loop, the Plug-In Environment Simulator isn't enough.
I can display the Front Panel of Process.vi clone by modifying the VI properties to show front panel on call. I can then see the clone's indicators updating and access controls, which does help debugging somewhat. However, I really want to see and probe the clone's block diagram.
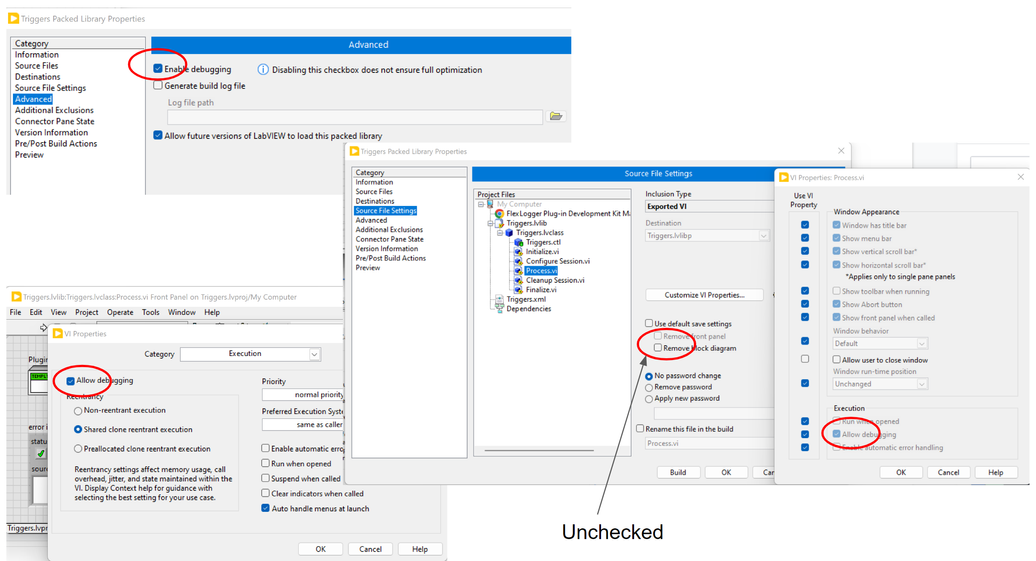
I have clicked "Allow Debugging" in the VI and Build properties. I have UNchecked "Remove Block Diagram". My understanding is that you can see the block diagram and probe even on reentrant clones in libraries when the above properties are set correctly.
But when running the plug-in, I see the Front Panel, but can not access the Block Diagram. Ctrl+E does not work. The "Window" menu item does not include "Show Block Diagram".
I've attached a project that is an extension of the Calculation Plug-In template. The only changes are to Process.vi and various VI and Build settings in an attempt to access the clone's front panel, block diagram, and allow probes and debugging. Am I simply missing something to get access to the clone's block diagram?
11-10-2022 08:02 AM
- Mark as New
- Bookmark
- Subscribe
- Mute
- Subscribe to RSS Feed
- Permalink
- Report to a Moderator
To debug the built plugin, I usually use the attached VI and DgbView.exe to print out what is happening since there's not a good way to use breakpoints and probes with the built plugin. The example you attached is not very helpful for understanding your issue since it's basically the default project. Why is the Plug-in Environment Simulator not enough? Maybe if you attach your real plugin and describe what isn't working, it would make it easier to help you determine what is going wrong. I can provide my email if you don't want to post it on the public forum.
Using the DbgView.exe is usually what I use since often times highlight execution and breakpoints can interfere with the run time behavior and I end up debugging something that's due to timing being off instead of the real issue.
Hope this helps,
Brad
11-10-2022 10:35 AM - edited 11-10-2022 10:38 AM
- Mark as New
- Bookmark
- Subscribe
- Mute
- Subscribe to RSS Feed
- Permalink
- Report to a Moderator
Thanks, I'll take a look at that debug VI.
I'm not looking to debug a specific plug-in. I'm interested in the generalized case of improving debugging of plug-ins. Thus the attached example is as simple as possible.
I'm still not certain why we can't see the block diagram if the packed library build settings allow for debugging and retaining the block diagram. The project that was attached had all of those options enabled as shown in the attached image.
11-11-2022 06:09 AM
- Mark as New
- Bookmark
- Subscribe
- Mute
- Subscribe to RSS Feed
- Permalink
- Report to a Moderator
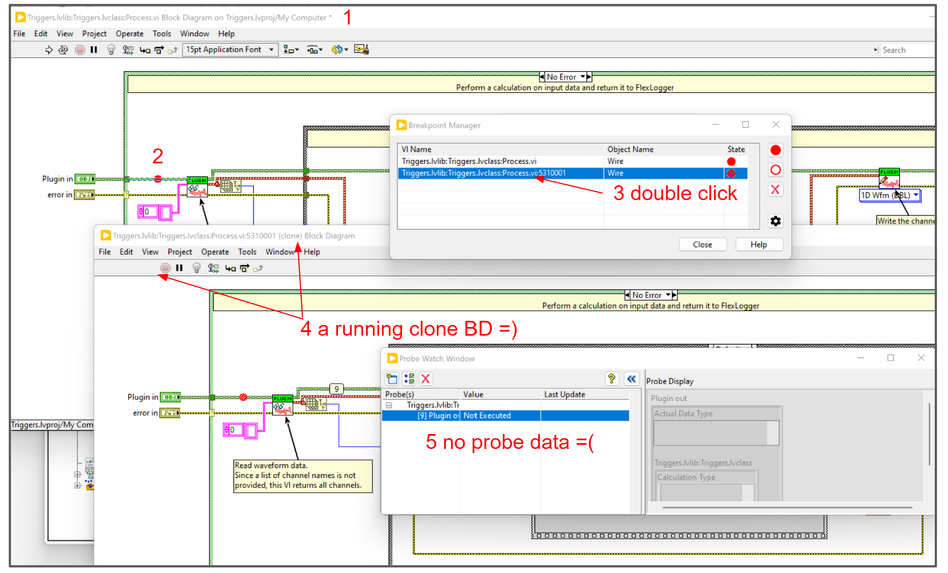
So I found a way to pull up the clone's Block Diagram while it's running. All of the build settings I mention above have to be modified (the project that is attached to my earlier post in this thread has the correct settings). Then if you place a breakpoint in the non-clone's Block Diagram it puts the break point in all the clones as well (although the clone never actually breaks). Then while the clone is running, you double click it's point in the break point manager and the running clone's Block Diagram pops open.
However ... even if you probe the running clone's Block Diagram, they only say "not executed".
So now I have the clone's front panel (which works great), it's running block diagram, but non-working probes. One step closer than before anyway...


