Overview
This program takes data in the form of a two-dimensional array and a cluster of elements and displays multiple plots on a single waveform charts. With this example stacked plots can also be created.
Description
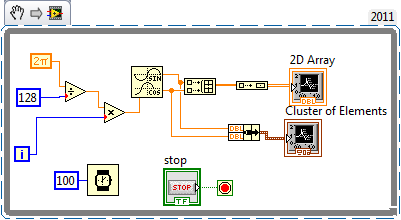
This program generates a sine and cosine waves and plots them to a waveform chart. This is done by creating a cluster of elements as well as a 2D array. Using both data types in 2 separate charts allows the user to better understand the different steps necessary to create stacked plots for each chart.
Steps to Implement or Execute Code
- Open the Multiple Plots VI.
- Run the code and see how you can successfully have multiple plots on a single chart.
- Create stacked plots.
- On the cluster of elements chart right click and select "Stack Plots".
- Right click on the 2D array chart and go to visible items and make the plot legend visible.
- Resize the 2D array chart plot legend to contain two plots.
- Right click on the 2D array chart and select stack plots.
Requirements
Software
LabVIEW 2011
Hardware
Additional Images or Video
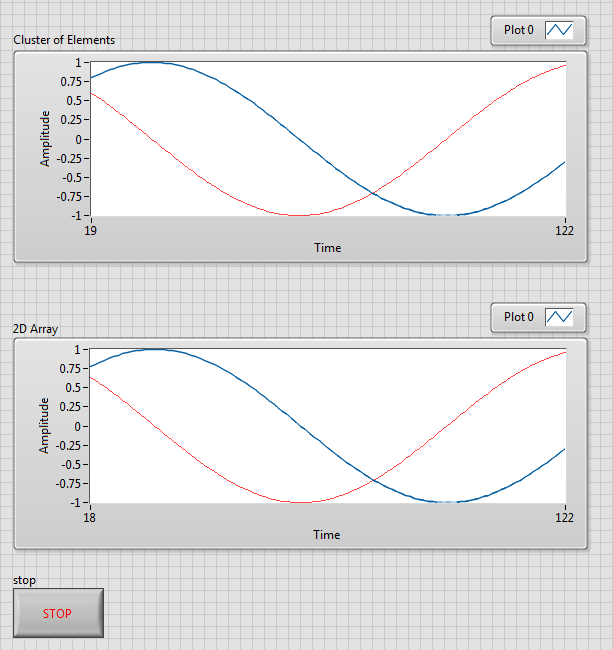
Figure 1: This figure displays how multiple plots can be displayed on one chart
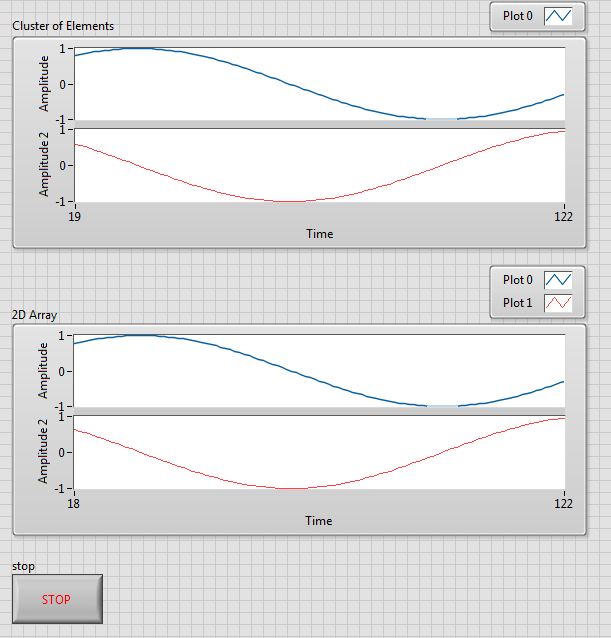
Figure 2: This figure shows stacked plots which is a different way to display multiple plots on the same chart. Notice the 2D Array chart has to have both plots in the plot legend.
Matt P.
Applications Engineer
National Instruments
