Turn on suggestions
Auto-suggest helps you quickly narrow down your search results by suggesting possible matches as you type.
Showing results for
How can I have a Waveform Chart using a Waveform Graph?
by:
matteobr
 Example_Scrubber_Stephan
06-07-2017
10:15 AM
05-14-2009
03:03 AM
Last Edited by:
Document options
- Subscribe to RSS Feed
- Mark as New
- Mark as Read
- Bookmark
- Subscribe
- Printer Friendly Page
- Report to a Moderator
Products and Environment
This section reflects the products and operating system used to create the example.To download NI software, including the products shown below, visit ni.com/downloads.
- LabVIEW
Software
Code and Documents
Attachment
Download All
Virus scan in progress. Please wait to download attachments.
Overview
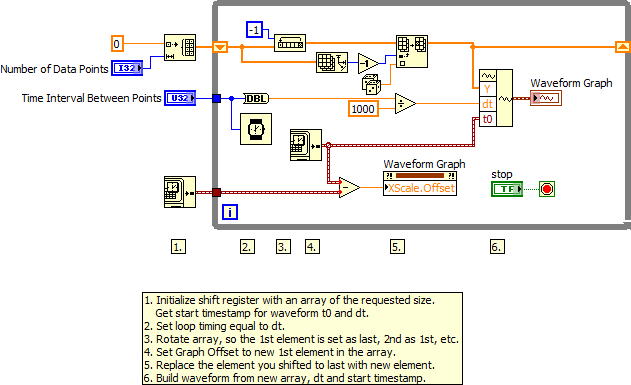
This example demonstrates how to use a Waveform Graph as a Waveform Chart.
Description
This VI shows how to implement a graph with chart behavior. A graph plots all the available datapoints at once so in order to update it at each iteration like a chart the VI updates the data. In this case a random value is used as data. At the first iteration it initializes all the datapoints on the graph to zero then each iteration the new data is inserted at the end of the array and the waveform is rebuilt. The x-axis scrolls with the data as it updated.
Requirements
Software
- LabVIEW Base Development System 2012 (or compatible)
- If running in a Real-Time context, you will need the LabVIEW Real-Time Module 2012 (or compatible)
Hardware
- No hardware is necessary to use this example VI
Steps to Implement or Execute Code
- Download and open the attached file
- Run the program
Additional Information or References
Why Can I Not Use Cursors in a Waveform Chart?
**The code for this example has been edited to meet the new Community Example Style Guidelines. The edited copy is marked with the text ‘NIVerified’. Read here for more information about the new Example Guidelines and Community Platform.**
Matteo Brunella
Application Engineer
NI Italy
Application Engineer
NI Italy
Example code from the Example Code Exchange in the NI Community is licensed with the MIT license.
Comments
Options
- Mark as Read
- Mark as New
- Bookmark
- Permalink
- Report to a Moderator
02-16-2015
11:56 PM
The dt input in this sample is incorrect.
The correct units are seconds, so the milisecond input "Time Interval Between Points" should be divided by 1000 first before being input into the Waveform "dt" input.


