V-I Curve Tracer for NI myDAQ
- Subscribe to RSS Feed
- Mark as New
- Mark as Read
- Bookmark
- Subscribe
- Printer Friendly Page
- Report to a Moderator
Code and Documents
Attachment
Introduction: Use NI myDAQ to interactively explore and plot the voltage-current (V-I) characteristic of a two-terminal device.
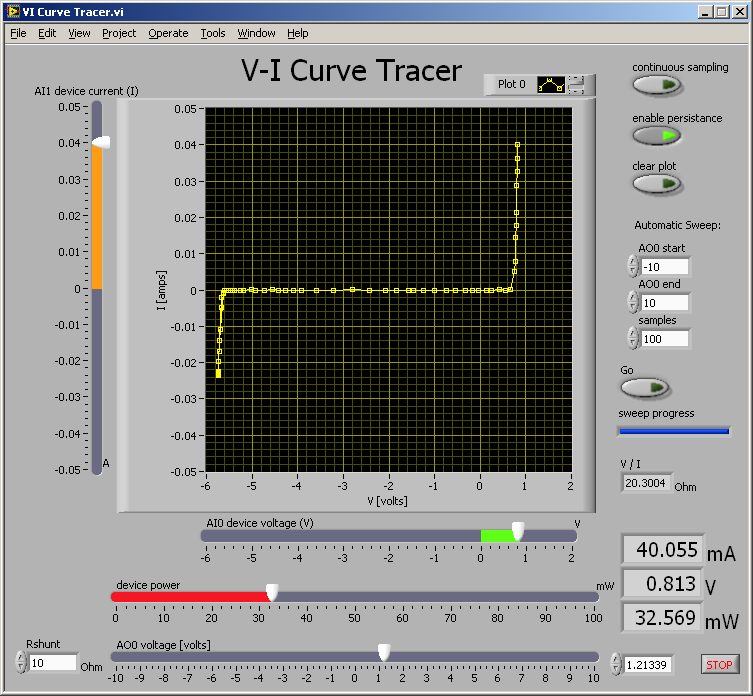
The "V-I Curve Tracer" application supports the following exploration modes:
- Interactive single point: Adjust the applied voltage on "Analog Output 0" (AO0) and observe the device voltage and current as a single point
- Interactive plot: Enable persistence to trace a series of voltage-current points as a plot
- Automated sweep: Automatically step the applied voltage over a user-specified range
Double-click the upper and lower axis limits on the plot window to change the plot range. The green and orange pointer slide indicators change automatically to match the plot window limits.
Equipment Setup: Use an op amp voltage follower to boost the current drive capability of the applied voltage on AO0:

References: This application appears in two NI myDAQ mini-labs:
Example code from the Example Code Exchange in the NI Community is licensed with the MIT license.
- Mark as Read
- Mark as New
- Bookmark
- Permalink
- Report to a Moderator
Good Day,
I am surprised to see very little, if any feedback or comments on this great VI and design.
This is a very useful implementation based on the well-known component tester principle (sometimes also called an Octopus tester). Thank you. I like the front panel for its simplicity and the persistence mode in particular. One can also implement this with the entry- level USB-6008/6009 hardware, and add another amplifier stage to overcome its 0 to 5V output level limitations.
edoering, please allow me a suggestion. I cannot see any power supply bypassing in your external HW-design. You might want to add a 100µF electrolytic cap and a 100nF ceramic or film cap in parallel with the OpAmp supplies, close to the OpAmp pins on the bread board. This helps to prevent oscillations and all sorts of potential issues. Local bypassing caps might not be neccessary in your application, but this seems an ideal opportunity to make beginners aware of this.
Keep up with the good work,
hyperhyper
- Mark as Read
- Mark as New
- Bookmark
- Permalink
- Report to a Moderator
Thanks for your comments, this was a particularly enjoyable project for me. Thanks also for raising the issue about power supply bypassing.
- Mark as Read
- Mark as New
- Bookmark
- Permalink
- Report to a Moderator
Can you please explain what should be changed if NI USB-6009 is used instead and is this set up appropriate for solar cells testing?
- Mark as Read
- Mark as New
- Bookmark
- Permalink
- Report to a Moderator
Good Day,
in reply to your quesiton:
- Change the VI to use the drivers for USB-6008/6009
- Configure the DAQ Assistant VIs in the block diagram to match your HW configuration (i.e. RSE for single-ended measurements)
- Change the V/I-plot settings to accomodate ranges (USB-6008 can only source unipolar voltages)
I have made some minor cosmetical changes to the front panel, see the attached screenshot. This shows the V/I curve of an ordinary 1N4004 Si-diode.
Cheers,
hyperhyper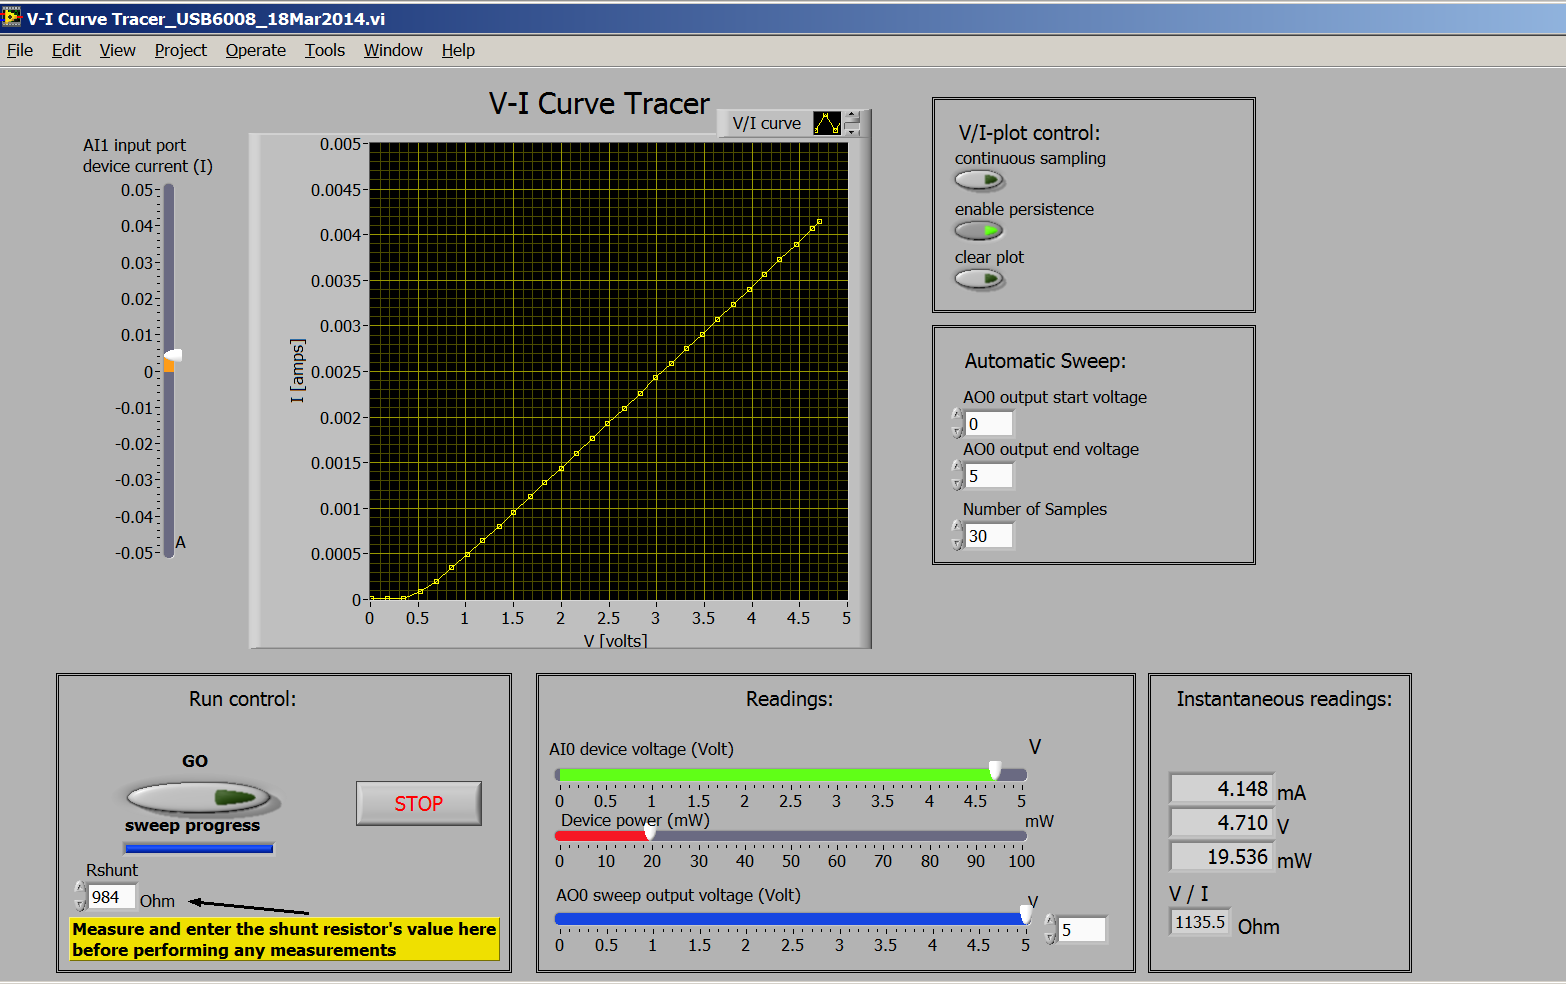
- Mark as Read
- Mark as New
- Bookmark
- Permalink
- Report to a Moderator
A few minor changes. This VI 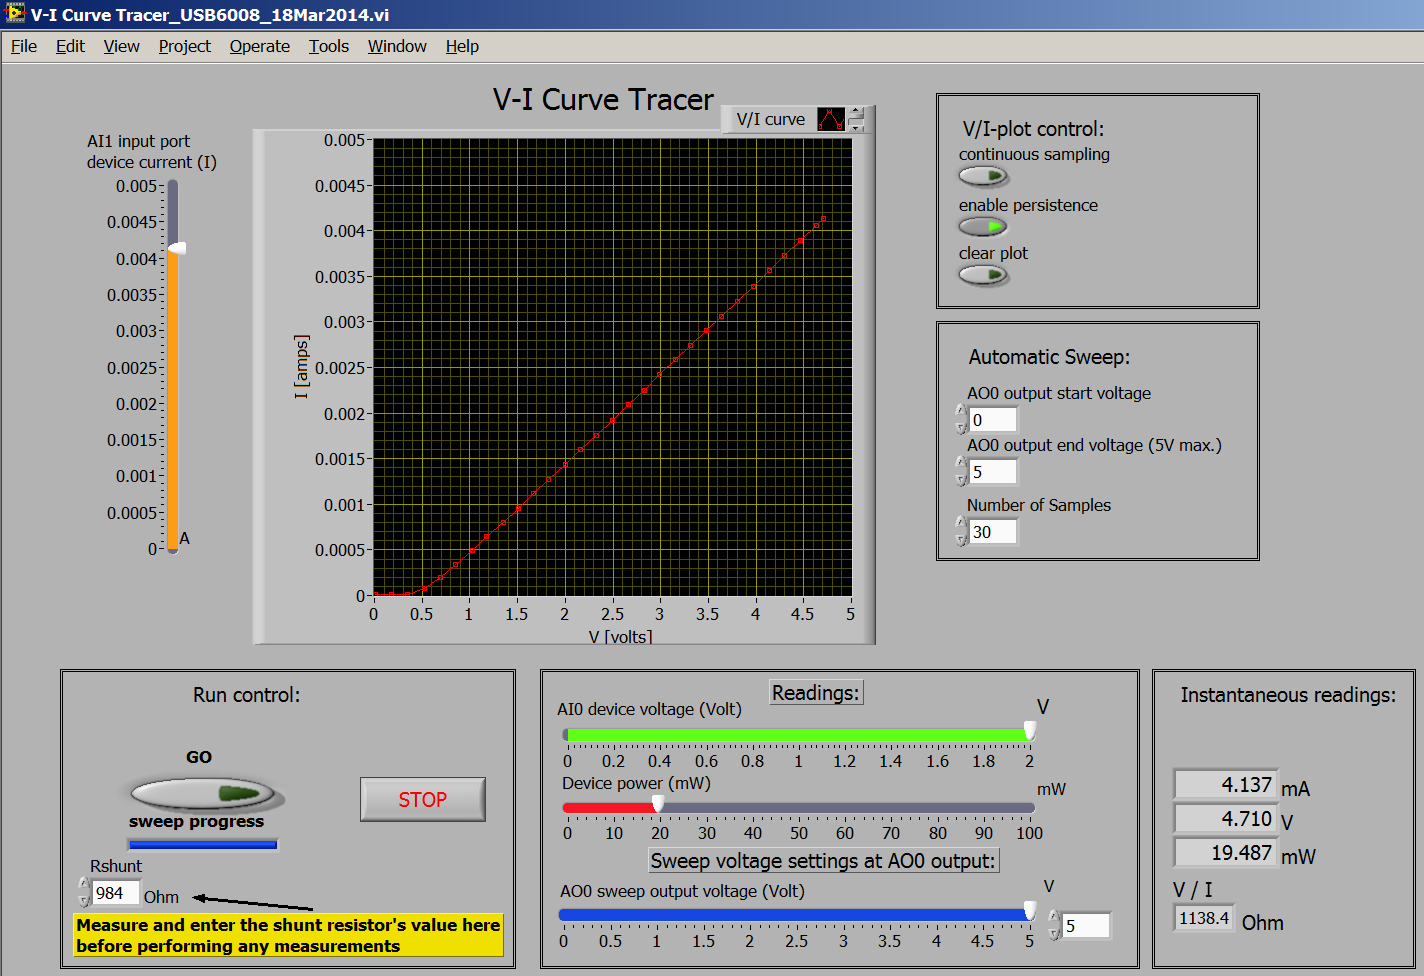 uses the USB-6008 HW without any external buffers (limited to sourcing 5mA and 5V).
Cheers,
hyperhyper
- Mark as Read
- Mark as New
- Bookmark
- Permalink
- Report to a Moderator
Hi
If i am using the usb-6008 for measurement. Does the circuit connection changes?
Also, may I have the vi for the usb-6008.
Thanks
- Mark as Read
- Mark as New
- Bookmark
- Permalink
- Report to a Moderator
How to export the measured values (GO button) to file?
- Mark as Read
- Mark as New
- Bookmark
- Permalink
- Report to a Moderator
thnx
- Mark as Read
- Mark as New
- Bookmark
- Permalink
- Report to a Moderator
@edoering wrote:
Introduction: Use NI myDAQ to interactively explore and plot the voltage-current (V-I) characteristic of a two-terminal device.
The "V-I Curve Tracer" application supports the following exploration modes:
- Interactive single point: Adjust the applied voltage on "Analog Output 0" (AO0) and observe the device voltage and current as a single point
- Interactive plot: Enable persistence to trace a series of voltage-current points as a plot
- Automated sweep: Automatically step the applied voltage over a user-specified range
Double-click the upper and lower axis limits on the plot window to change the plot range. The green and orange pointer slide indicators change automatically to match the plot window limits.
Equipment Setup: Use an op amp voltage follower to boost the current drive capability of the applied voltage on AO0:
References: This application appears in two NI myDAQ mini-labs:
hi could you provide the VI for the USB-6008 version?
Im trying to make an IV trace of a PV cell for a university experiment.
Thank you!
- Mark as Read
- Mark as New
- Bookmark
- Permalink
- Report to a Moderator
This is the only version of the code that I have available, hopefully you can adapt the code to your product.
- Mark as Read
- Mark as New
- Bookmark
- Permalink
- Report to a Moderator
Hi everyone,
I'm a beginner with labview and i got an assignment that i should show V-I of a diode.
You can see my results in attachment .... The only problem is i cant show my results in a xy plot. (I've tried actually but it shows nothing)!
Can anyone help me , please?
https://ufile.io/r5miq ( I've uploaded my .vi file )
- Mark as Read
- Mark as New
- Bookmark
- Permalink
- Report to a Moderator
Hi, im Davi, an physics student from Brazil, studying in the federal university of pernambuco. I need a similiar kind of program, to graph specifically an I-V curve, but i don´t have the DAQ module. I´m trying to do a VISA based program. Is there a similar program using VISA, instead of DAQ? Anyways, thanks for reading!
