LabVIEW Tutorial

Tutorial


LabVIEW Tutorial: Getting Started with LabVIEW Programming Basics

Step-by-step instructions guide you from download to launching your first LabVIEW project. Learn the basics of graphical programming with LabVIEW.


Additional Languages

Deustch
Español
Français
Japanese (日本語)
Korean (한국어)
Chinese (简体中文)

6 Steps for Getting Started with LabVIEW

This tutorial is designed to introduce you to the core concepts needed for initial LabVIEW setup through starting a new project.


Before You Begin


Software

  • Access email for LabVIEW and any optional LabVIEW add-ons. Refer to the Download and install software section for more information if you do not have this email

Hardware

  • Development computer

Accessories

  • No accesories are required

Set Up Software

Step 1.

During this process, you will be installing and activating the following software and drivers on your development computer:

  • LabVIEW

Download and install LabVIEW software animation

  1. Download LabVIEW. Customers can access software downloads from ni.com in two ways:
    • Software claim email:
      1. After you buy LabVIEW or other software modules, you or your purchasing agent receives an email to claim access to NI software. Click the ACCEPT ACCESS button in the email and log in to your ni.com account to complete your claim.
      2. After you’ve claimed access to your software, you will see a screen that confirms your access and includes a link to download the software. If you have not already done so, download your software using this link.

    • If you did not receive or do not have this email, follow these steps:
      1. Go to the LabVIEW Download Page.
      2. Select the version of LabVIEW that you want, and then click Download. If you are not logged in, you will be required to do so. For older versions of LabVIEW, refer to Download Older Versions of NI Software.
  2. After your download is complete, launch the executable. This step installs Package Manager or updates it, if needed.
  3. After Package Manager is installed, follow the prompts to complete the installation of LabVIEW.
      • You can select any other add-ons or drivers that you know you'll need for your application or that you have a license for, but only LabVIEW is required for this tutorial. 
      • Notice that you can return to this installation and add anything else you need later.

  1. After the installation is complete, the Activation Wizard opens automatically. Follow the prompts to activate your software. If you are activating on an offline computer or through a license agreement, you may need additional activation information.

Return to top

Overview of the Environment

Step 2.

LabVIEW programs are called virtual instruments, or VIs, because their appearance and operation often imitate physical instruments, such as oscilloscopes and multimeters. LabVIEW contains a comprehensive set of tools for acquiring, analyzing, displaying, and storing data, as well as tools to help you troubleshoot the code you write.


When you create a new VI, you see two windows: the front panel and the block diagram. The front panel is the user interface for the VI, and the block diagram contains the graphical source code of the LabVIEW program.


Video Thumbnail
3:21
  1. LabVIEW Front Panel
  2. The front panel window is the user interface for the VI. You create the user interface of a VI by placing controls and indicators on the front panel of a VI. Controls define inputs, and indicators display outputs.


    When you interact with a front panel as a user interface, you can modify controls to supply inputs and see the results in indicators. You also can use the front panel to pass inputs and receive outputs when you call your VI from the block diagram of a different VI.


    • Controls Palette
    • The Controls palette contains the controls and indicators you use to create the front panel. You access the Controls palette from the front panel window by selecting View»Controls Palette or by right-clicking on any empty space in the front panel window. The Controls palette is broken into various categories called subpalettes; you can expose some or all of these categories to suit your needs.

      LabVIEW Front Panel screen shot

      (1) Front Panel Window | (2) Toolbar | (3) Controls Palette


      After opening the Controls palette, place controls and indicators on the front panel by clicking on icons from the palettes. Then, click on the front panel where you would like the control or indicator to be placed.

       
    • Controls and Indicators

    • Controls simulate instrument input devices and supply data to the block diagram of the VI. They are typically knobs, push buttons, dials, sliders, and strings. 


      Indicators simulate instrument output devices and display data the block diagram acquires or generates. They are typically graphs, charts, LEDs, and status strings.


  3. Data Types

  4. Each control and indicator has a data type associated with it. Subpalettes of the Controls palette contain controls and indicators grouped by data type


    The most commonly used data types are numeric, Boolean value, and string.


Video Thumbnail
4:25

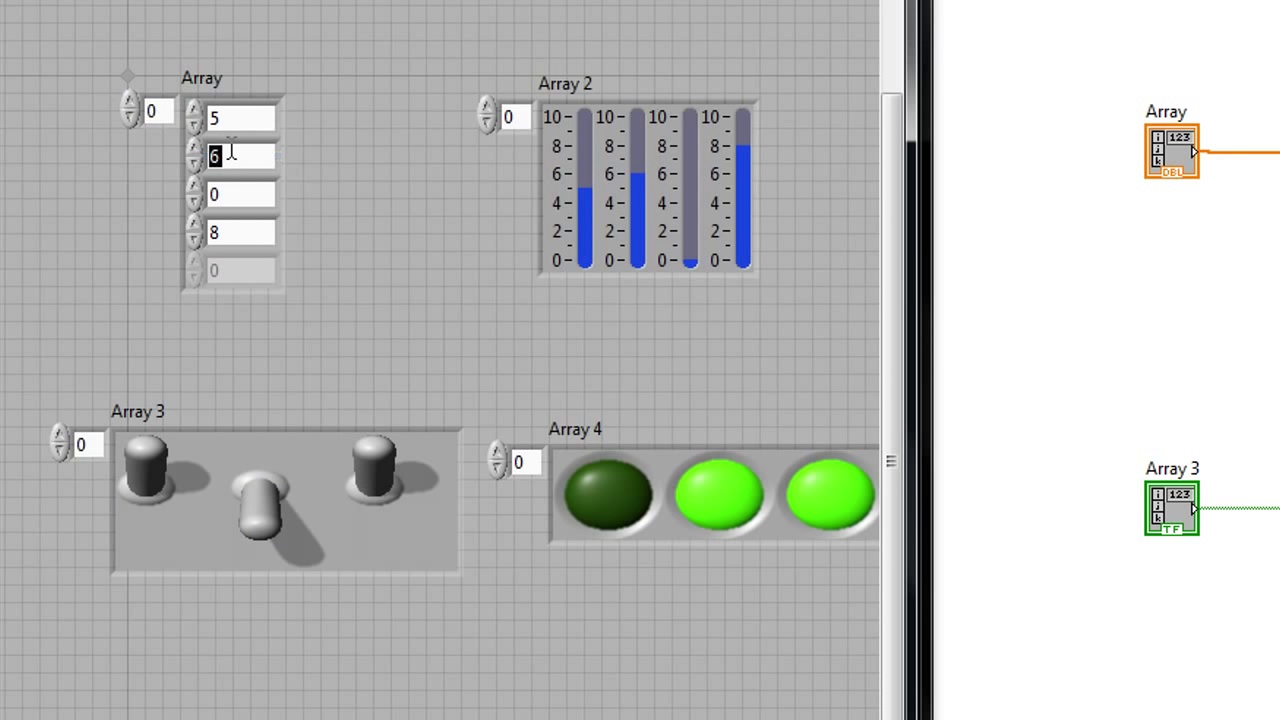
You can use arrays to group elements of the same data type.

Video Thumbnail
3:51
  1. LabVIEW Block Diagram

  2. After you create the front panel window, you add code to the LabVIEW block diagram using graphical representations of functions to complete calculations and control the front panel objects. To bring up the block diagram, select Window»Show Block Diagram  from the menu bar. Additionally, you can toggle between the block diagram and the front panel by pressing  <Ctrl-E>.


    Block diagram objects include terminals, subVIs, functions, constants, structures, and wires, which transfer data among other block diagram objects.

    LabVIEW Block Diagram screen shot

    (1) Indicator Terminals | (2) Wires | (3) Nodes | (4) Control Terminals


    1. Terminals
    2. Front panel objects appear as terminals on the block diagram. Terminals on the block diagram reflect the changes made to their corresponding front panel objects and vice versa.

      LabVIEW Terminals screen shot

      Terminals are entry and exit ports that exchange information between the front panel and block diagram. They are analogous to parameters and constants in text-based programming languages.


    3. Constants
    4. In addition to controls and indicators, you can have constants on the block diagram for static values needed in your code. You can have constants for any data type.


      Consider an algorithm for computing the area of a triangle. You might have the following front panel and corresponding block diagram.
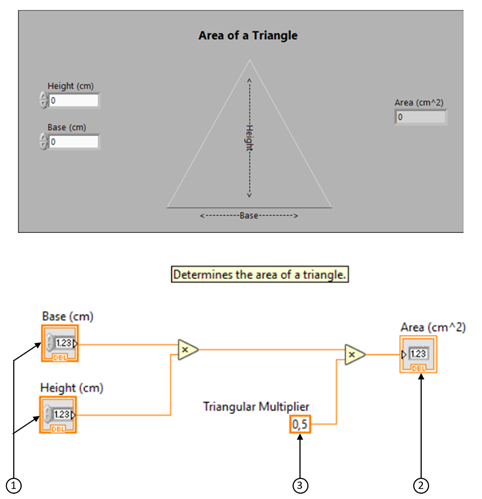
      LabVIEW front panel and block diagram example screen shot

      (1) Controls | (2) Indicator | (3) Constant


      The constant Triangular Multiplier does not appear on the front panel window. It simply passes the value of .5 into the multiply function.

      Notice that the Base(cm) and Height(cm) block diagram terminals look different from the Area(cm^2) terminal. 

      There are two distinguishing characteristics between a control and an indicator on the block diagram. The first is an arrow on the terminal that indicates the direction of data flow. The controls have arrows showing the data leaving the terminal, whereas the indicator has an arrow showing the data entering the terminal. The second distinguishing characteristic is the border around the terminal. Controls have a thick border and indicators have a thin border.


    5. Block Diagram Nodes
    6. Nodes are objects on the block diagram that have inputs and/or outputs and perform operations when a VI runs. They are analogous to statements, operators, functions, and subroutines in text-based programming languages. Nodes can be functions, subVIs, or structures. Structures are process control elements, such as case structures, for loops, or while loops.

      LabVIEW Block Diagram nodes screen shot

    7. Functions
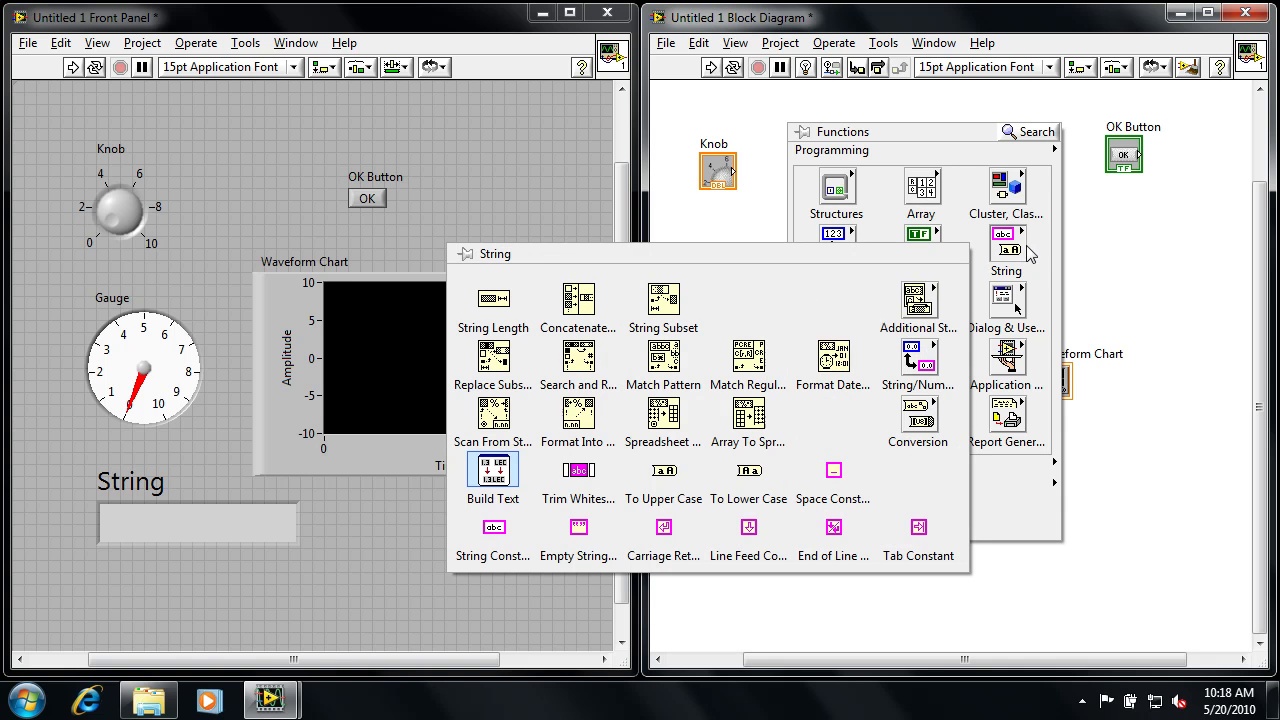
    8. To place objects on the block diagram, simply drag and drop them from the Functions palette. The Functions palette automatically appears when you right-click anywhere on the block diagram workspace. It contains functions, constants, structures, and some subVIs.
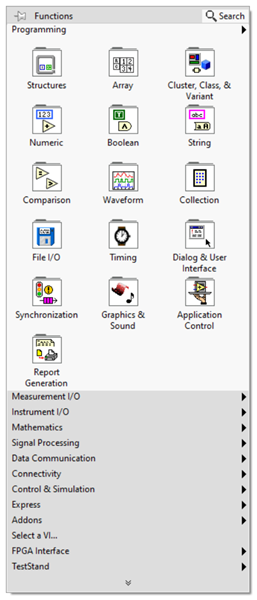
      LabVIEW Functions screen shot

      The  Search  button on the Functions palette opens a search dialog box that you can use to search for functions by name. It takes a few moments to launch.


      After you see the function you want, double-click on it and LabVIEW jumps to the place on the Functions palette where you can find that function.


      Functions are the fundamental operating elements of LabVIEW. Functions do not have front panel windows or block diagram windows, but they do have input and output terminals for passing data in and out similarly to controls and indicators. You can tell if a block diagram object is a function by the pale-yellow background on its icon. The Functions palette has functions arranged in groups based on the type of function they perform. For example, you can look in the Numeric subpalette for functions that perform numeric operations.
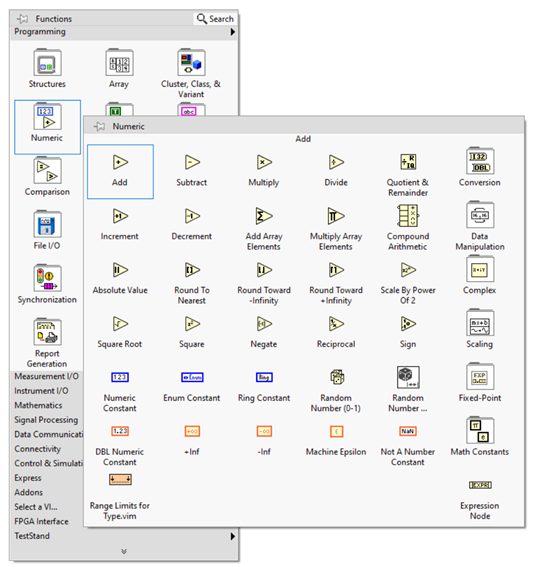
      LabVIEW Numeric Functions screen shot


  1. SubVIs

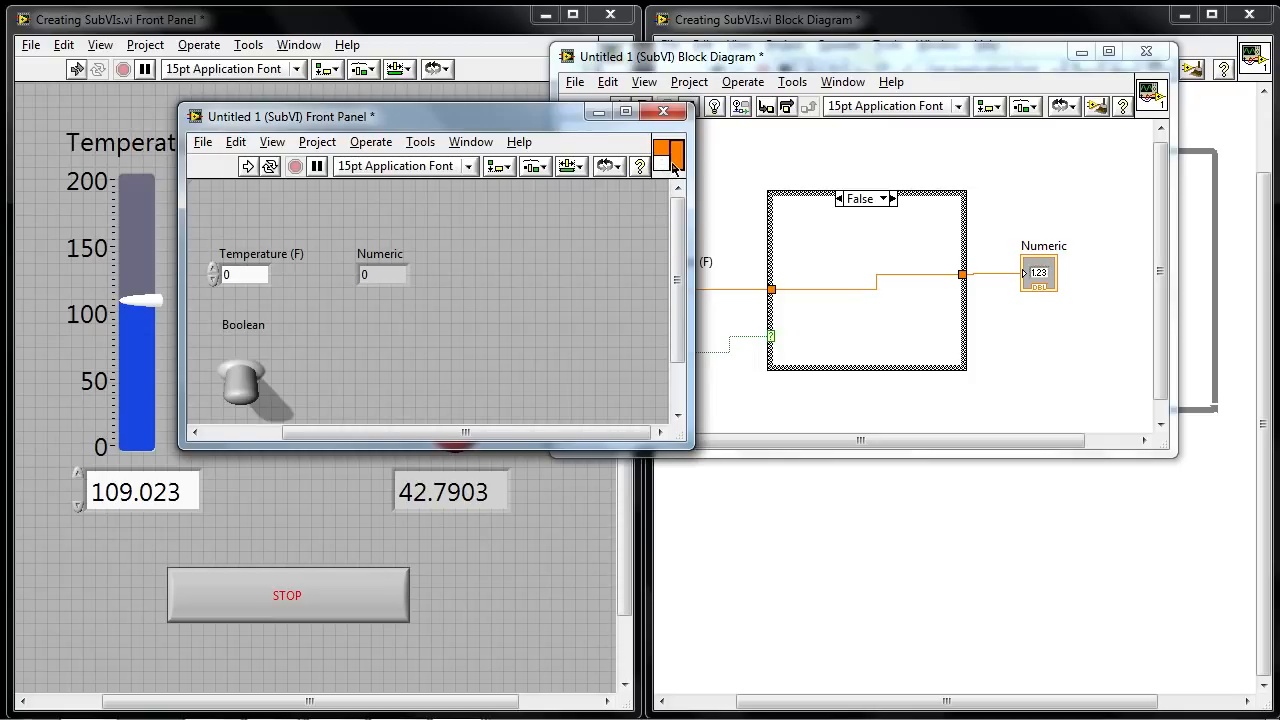
  2. SubVIs are VIs that you create to use inside another VI. Once created, you can add your subVIs to the Functions palette and reuse the code inside other LabVIEW projects

Video Thumbnail
5:23

Any VI has the potential to be used as a subVI. When you double-click a subVI that is on the block diagram, its front panel window appears and you can access it s block diagram.


  1. Structures

  2. Structures, which include for loops, case structures, and while loops, are used for process control. You can open the Structures subpalette from the  Functions  palette under Programming.

    Below are some examples of different structures and how they look on the block diagram.

    LabVIEW Structures and how they appear on the block diagram


Return to top

Programming Basics

Step 3.

  1. Navigating through VIs with the Tools Palette
Video Thumbnail
6:36

You can use LabVIEW tools to create, modify, and debug a VI. A tool is a special operating mode of the mouse cursor, so the operating mode of the cursor corresponds to the icon of the tool selected.


LabVIEW chooses which tool to select based on the current location of the mouse. You can manually choose the tool you need by selecting it on the Tools palette (from the menu bar, select View»Tools Palette).  Now you can choose your desired tool, which remains selected until you choose another tool from the Tools palette.

LabVIEW Tools palette screen shot

  1. Data Flow Programming

  2. LabVIEW follows a dataflow model for running VIs. A block diagram node executes when it receives all required inputs. When a node executes, it produces output data and passes the data to the next node in the dataflow path. The movement of data through the nodes determines the execution order of the VIs and functions on the block diagram.

Video Thumbnail
4:04
  1. Wires

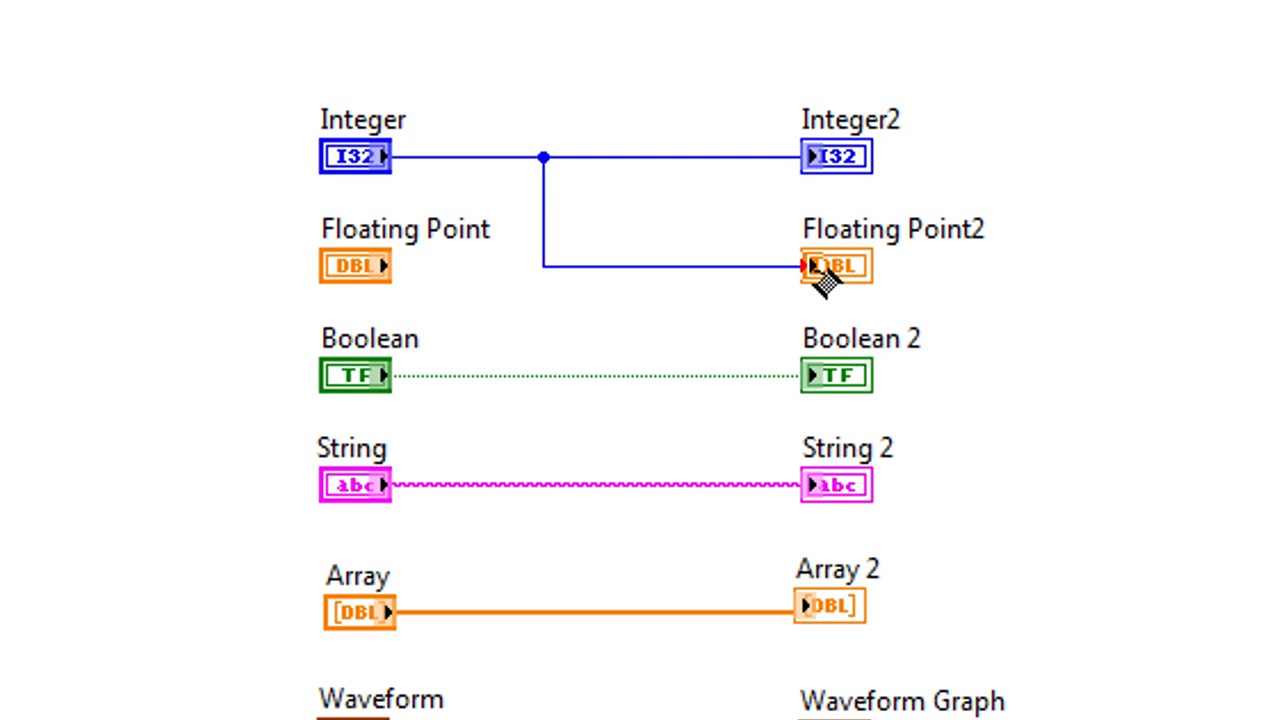
  2. You transfer data among block diagram objects through wires. In the figures above, wires connect the control and indicator terminals to the Add and Subtract function. Each wire has a single data source, but you can wire it to many VIs and functions that read the data. Wires are different colors, styles, and thicknesses, depending on their data types.


    A broken wire appears as a dashed black line with a red X in the middle, as shown above. Broken wires occur for a variety of reasons, such as when you try to wire two objects with incompatible data types

    LabVIEW wire type screen shot


  3. Manually Wiring Objects
  4. When you pass the Wiring tool over a terminal, a tip strip appears with the name of the terminal. In addition, the terminal blinks in the Context Help window and on the icon to help you verify that you are wiring to the correct terminal.


    To wire objects together:

    1. Pass the Wiring tool over the first terminal and click.
    2. Pass the cursor over the second terminal and click again.


    To clean up your wiring:

    1. You can right-click the wire and select Clean Up Wire from the shortcut menu to have LabVIEW automatically choose a path for the wire.
    2. If you have broken wires to remove, press to delete all the broken wires on the block diagram.


  5. Common Loops and Structures
    1. For Loops and While Loops
    2. For Loops and While Loops are commonly used structures in LabVIEW.

    • A For Loop is a structure used to execute a block of code a set number of times.
    • A While Loop is structure you use to execute a block of code repeatedly until a condition is met.

    Tutorials for both the For Loop and While Loop structures are available to familiarize yourself with these structures using LabVIEW’s graphical programming and their use cases.


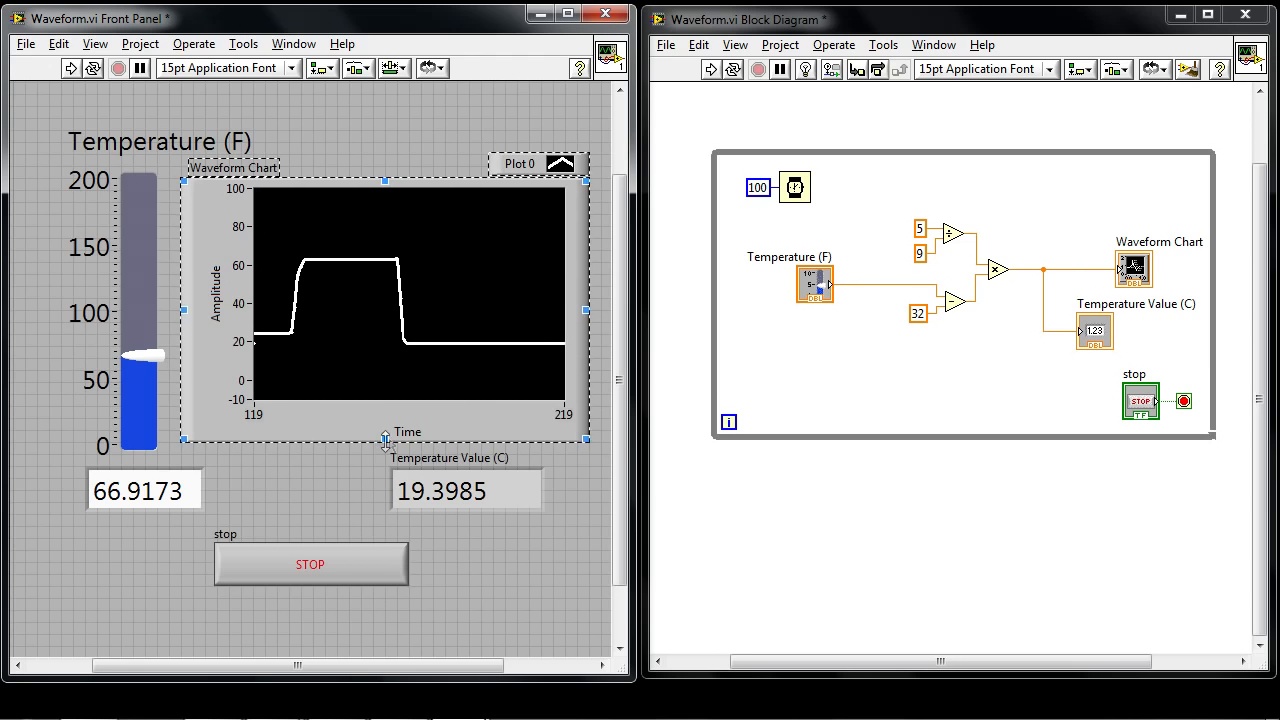
    One use case for both For Loops and While Loops is the building of a data set to be visualized in a chart or graph.

Video Thumbnail
3:17
  1. Case Structures

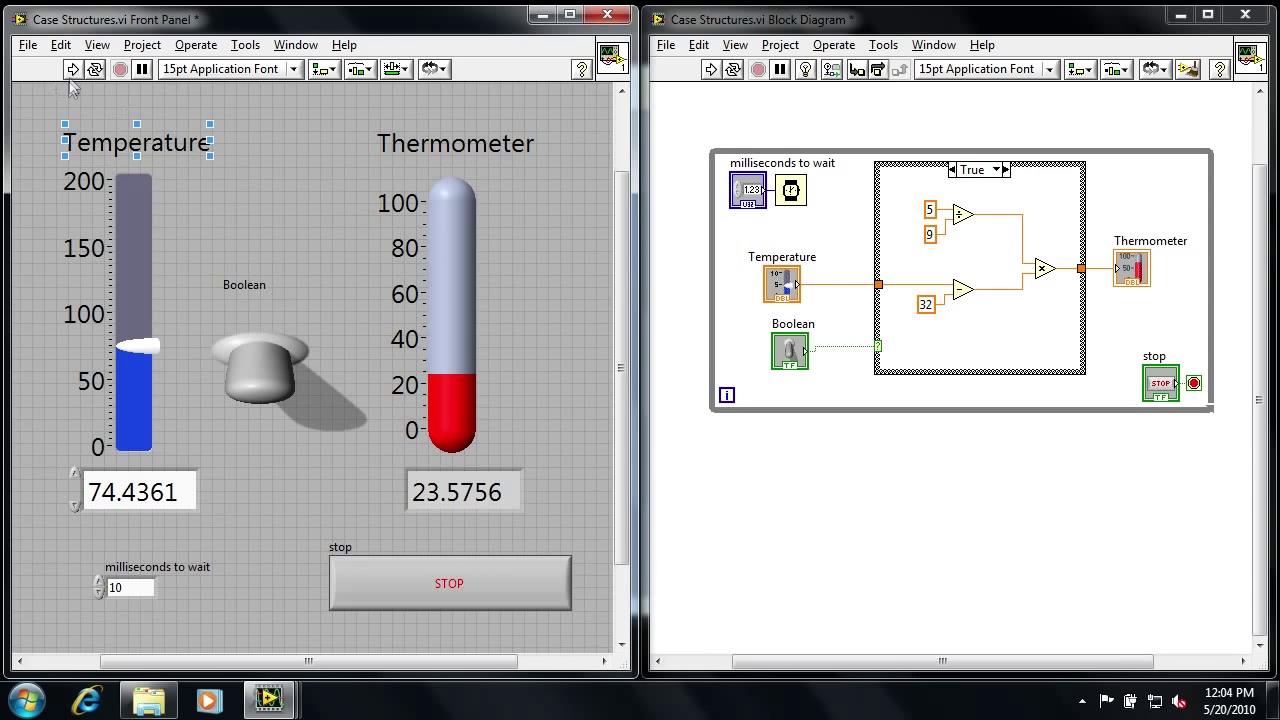
  2. In text-based languages, you may be familiar with the if, if-else, or switch statements; the Case Structure is LabVIEW’s equivalent programming structure and is used when the code that executes depends on the value of an input.


Return to top

Video Thumbnail
3:53

Common Tools

Step 4.

  1. VI Toolbar
  2. Each window of your VI has a toolbar associated with it. Use the front panel window toolbar buttons to run and edit the VI.


    The following toolbar appears on the front panel window.

    LabVIEW VI Toolbar screen shot

    LabVIEW run button imageClick the Run button to run a VI. You do not need to compile the VI as LabVIEW automatically compiles it.

    You can run a VI if the Run button appears as a solid white arrow, as shown at left. The Run arrow will change appearance after you have clicked on it to indicate that the code is running.


    Other tools exist on the front panel toolbar to help you run your VI continuously, pause, stop, or abort execution, as well as modify the appearance of the front panel.


    The Block Diagram Window Toolbar contains all the buttons to control running and stopping Vis, and many of the controls that aid in organizing your code. These buttons do the same thing on the block diagram as they do on the front panel.

    LabVIEW Block Diagram Window toolbar screen shot

    Additionally, the block diagram toolbar contains tools to aid in debugging.


  3. Debugging Tools

  4. LabVIEW software contains debugging tools to help you identify problem areas in your code so that you can make the appropriate changes. You may encounter two general types of software bugs: those that prevent the program from running and those that generate bad results or incorrect behavior.


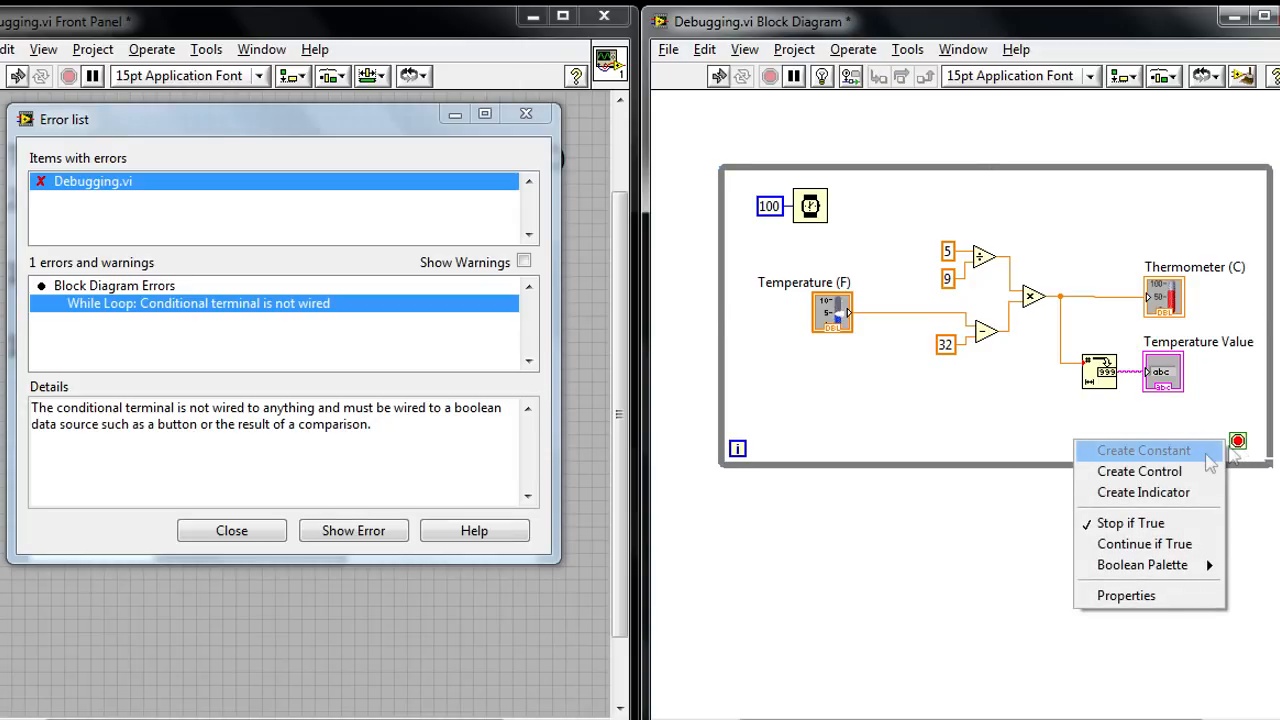
    If LabVIEW cannot run your VI, it informs you by changing the run arrow to a broken icon, and the Error List Window lists the specific reasons why the VI is broken.


    The second type of bug is typically harder to track down, but LabVIEW has several embedded debugging tools you can use to watch your code as it executes, which makes the process much easier.

Video Thumbnail
3:32
  1. Context Help Window
  2. The Context Help window displays basic information about LabVIEW objects when you move the cursor over each object. To toggle display of the Context Help window select Help»Show Context Help, press the <Ctrl+H> keys, or click the Show Context Help Window button on the toolbar.


    When you move the cursor over front panel and block diagram objects, the Context Help window displays the icon for subVIs, functions, constants, controls, and indicators, with wires attached to each terminal. When you move the cursor over dialog box options, the Context Help window displays descriptions of those options.

    LabVIEW Context Help Window screen shot

  3. NI Example Finder

  4. Use the NI Example Finder to browse or search examples installed on your computer. LabVIEW searches among hundreds of example VIs you can use and incorporate into VIs that you create. You can modify an example to fit an application, or you can copy and paste from one or more examples into a VI that you create. These examples demonstrate how to use LabVIEW to perform a wide variety of test, measurement, control, and design tasks. You can open the Example Finder from LabVIEW by navigating to Help»Find Examples….

    LabVIEW NI Example Finder window screen shot

    The Example Finder is organized by task or by directory structure. Hardware drivers such as NI-DAQmx or LabVIEW Plug and Play instrument drivers install examples into the Hardware Input and Output folder, which are good starting points when working with hardware devices.


    You can also use the Search tab within the Example Finder to search for examples by keyword.


    Examples can show you how to use specific VIs or functions. If you are working with a new function and want to know if there are any examples for it, right-click the VI on the block diagram or on the Functions palette and select Examples from the shortcut menu; this will display a help topic with links to examples for that VI or function.


Return to top

Running an Example

Step 5.

Using the information we have learned thus far, we can build a program to calculate the area of a triangle. We will start by creating the block diagram below.

LabVIEW creating a block diagram screen shot
  1. Open a blank VI from the toolbar. Select  File»New VI.
  2. Put two multiply functions on the block diagram by dragging them onto the block diagram from the Programming >> Numeric subpalette.
    • Tip: To copy an object on the block diagram, hold down while you click and drag the object.
  3. Hover your mouse over the left-most multiply function to make the input and output terminals appear.
    • If you hold your mouse over one of the terminals, the wire spool appears along with the name of the terminal you are hovering over.
    • To create a control for the y terminal, simply hover your mouse over it and right-click. Do the same for the x terminal on the left-most multiply function so that you have a control for each input terminal.
    LabVIEW multiply function and Create Control screen shotLabVIEW multiply function and Create Control screen shot
  4. Wire the output terminal of the left multiply function to the x input of the right multiply function by hovering your mouse over the output terminal. When it turns into the wiring spool, click and hold while you drag the wire to the desired input.
  5. LabVIEW wiring the output terminal screen shot

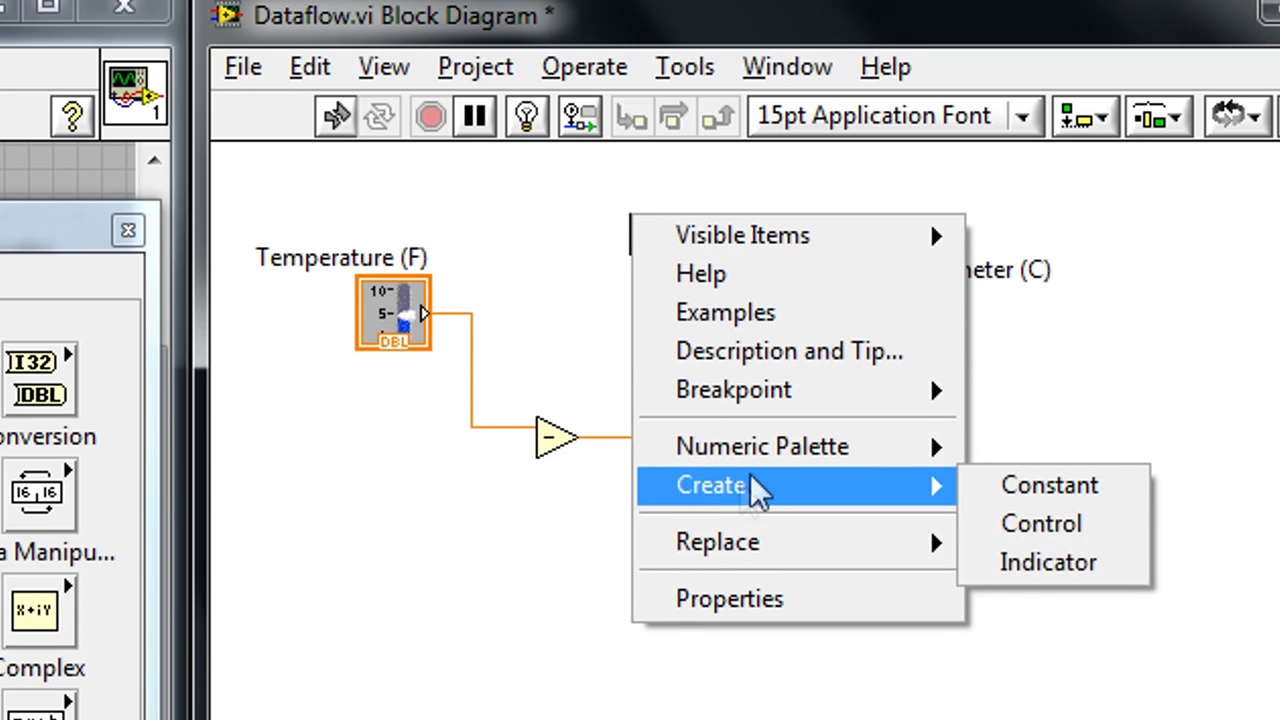
  6. Create the Triangular Multiplier constant .5 by right-clicking on the y input terminal of the right-most multiply function and selecting Create»Constant. You can change the value of a constant by double-clicking it to highlight the text and typing in the new value. Type in .5 and press <enter>.
  7. LabVIEW Create Constant menu screen shot

  8. Right-click the output of the right multiply function and select Create»Indicator to create an indicator that passes the value of the block diagram logic to the front panel.
    • Tip: You can make comments on the block diagram or the front panel by double-clicking the block diagram and typing your comment into the automatically created text box.
    • You can change the name of indicators, controls, and constants by double-clicking the label and typing in the desired name. If there is no label showing, right-click the desired object and select Visible Items»Label.

    LabVIEW setting a label to visible in a block diagram screen shot

  9. Look at the front panel that was generated from your work on the block diagram by pressing <Ctrl+E> or selecting Window»Show Front Panel. Notice that the two controls Base(cm) and Height(cm) and the indicator Area(cm^2) were automatically generated and placed on the front panel.
  10. LabVIEW Front Panel after block diagram screen shot

  11. On the block diagram, select a While Loop from the Programming >> Structures subpalette. To add the While Loop to your block diagram, left-click and drag the mouse until your code is contained within the loop
  12. In the bottom right corner of the while loop is the Conditional Terminal. Add a Stop button by right-clicking the terminal and selecting Create Control. The button created is automatically displayed on the front panel.
  13. Inside the While Loop, add a Wait (ms) function from the Programming >> Timing subpalette. Right-click on the milliseconds to wait terminal on the left and select Create Constant. Specify how often you would like the while loop to run, like every 500 ms.
    • The Wait (ms) function controls how often a loop executes, allowing time for processor to complete other tasks such as updating and responding to the user interface. If you do not configure loop timing, a while loop will continuously execute and not relinquish the processor to other tasks.
  14. LabVIEW Wait function loop screen shot

  15. Click the Run button on the VI you just created and change the values on the front panel. Watch how changing the control values of a and b updates the indicator value of a*b.
  16. Click the Stop button to stop the VI. Save and close the VI by selecting File»Save from the menu bar and then clicking the Close button in the top right corner of the front panel window.


Return to top

Starting a New Project

Step 6.

After you have installed your software and become familiar with the LabVIEW development environment, you are ready to begin working on your application. You also may find the following resources useful as you start developing.


Learn more about these common data types, structures, and code architectures.

Get a jump start on your application by utilizing built-in examples, templates, and sample projects.

Install add-ons and add libraries to add more capabilities

If you are using LabVIEW with NI hardware, you can utilize other Getting Started tutorials that walk-through hardware set up, configuration, and taking your first measurement.

Return to top

Where to Go Next

Resources

To continue learning about using  LabVIEW, NI provides you with a number of options.

Photo of Engineers using LabVIEW for test and measurement

Get more products up and running with easy, guided tutorials.

Return to Getting Started