- Document History
- Subscribe to RSS Feed
- Mark as New
- Mark as Read
- Bookmark
- Subscribe
- Printer Friendly Page
- Report to a Moderator
- Subscribe to RSS Feed
- Mark as New
- Mark as Read
- Bookmark
- Subscribe
- Printer Friendly Page
- Report to a Moderator
TreeGraph xControl
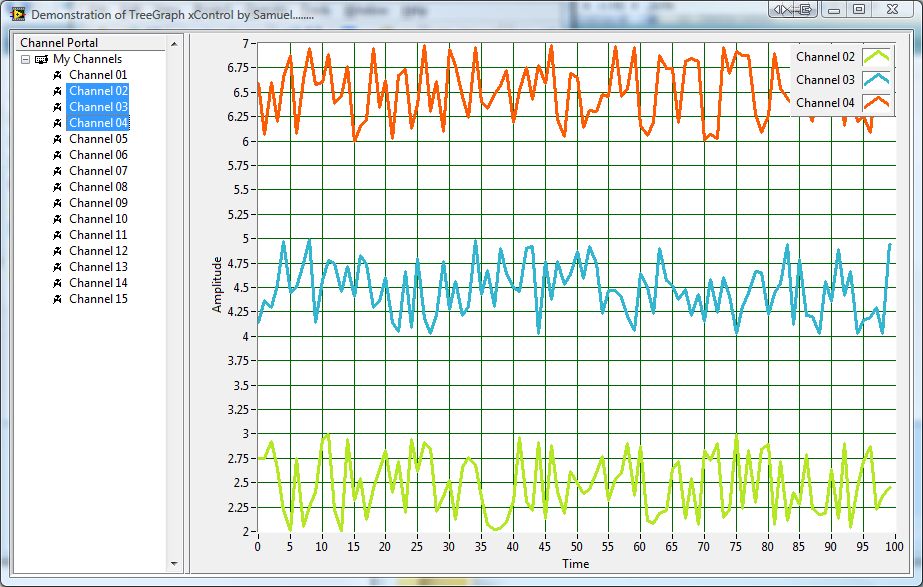
This TreeGraph xControl is a combination of Tree and Graph which looks similar to mixed graph. This xControl is fully open source. User can populate the channel list in the tree using "Channel List" property node of the xControl (The data type is 1D array of string).
All channel data will be continuously updated in the xControl. In order to view the required channel just select the channels from the tree (Use Ctrl or Shift key for multiple selection) and drop it over the graph. You can refer the below figure.
To see the demo do the following steps.
1. Download the TreeGraph.zip
2. Extract the zip file
3. Open "TreeGraph.lvproj" and run the "TreeGraph_Demo.vi"
Note: LabVIEW 2009 or latter version required to view the source code.
 Sorry for poor documentation.
 Hope you will enjoy and reuse this xControl.
 Share your valuable comments....
Warm Regards
Samuel James
Measurement Engineer,
Certified LabVIEW Developer,
Vestas Technology R&D, Chennai, India.
- Mark as Read
- Mark as New
- Bookmark
- Permalink
- Report to a Moderator
Very nice. 
- Mark as Read
- Mark as New
- Bookmark
- Permalink
- Report to a Moderator
Nice, but if the vertical axis has no correlation to the data then you must hide it.
Another option would be to let the user select which plot trace the scale is linked to.
- Mark as Read
- Mark as New
- Bookmark
- Permalink
- Report to a Moderator
I opened it in 2011 and I don't see anything on the graph when I run the example... it's blank. I didn't spend too much time troubleshooting, but I did verify that the xControl is getting data sent to it in the Timeout case of the event structure. I also do see the channels populate.
In general, I like the idea... just wondering why it isn't displaying data. Maybe I'm doing something dumb... *shrugs*
NI Director, Software Community
- Mark as Read
- Mark as New
- Bookmark
- Permalink
- Report to a Moderator
Disregard my post... Norm just showed me that I have to drag the channels onto the graph (d'oh!).
Very nice!
NI Director, Software Community
- Mark as Read
- Mark as New
- Bookmark
- Permalink
- Report to a Moderator
This is not a final control, It is just a basic idea, User should edit it to fit according to their needs.,
Thanks for your comments
- Mark as Read
- Mark as New
- Bookmark
- Permalink
- Report to a Moderator
awesome work,
Just one connection, in demo you only use a random data to display. How to have fixed graph values . for example in my experiment I have 8 channels and every for ever channel I have a some values that I have already calculated via DAQ , I jsut want those constant value to be displayed when user drags the channel on to the graph.
Thanks in advance.
Best Regards.
- Mark as Read
- Mark as New
- Bookmark
- Permalink
- Report to a Moderator
never mind just updated ur xcontrol with xy graph and made some changes now it works perfectly fine.
thanks once again
- Mark as Read
- Mark as New
- Bookmark
- Permalink
- Report to a Moderator
How do I access the index of the channels thats dragged onto the graph ?
