- Document History
- Subscribe to RSS Feed
- Mark as New
- Mark as Read
- Bookmark
- Subscribe
- Printer Friendly Page
- Report to a Moderator
- Subscribe to RSS Feed
- Mark as New
- Mark as Read
- Bookmark
- Subscribe
- Printer Friendly Page
- Report to a Moderator
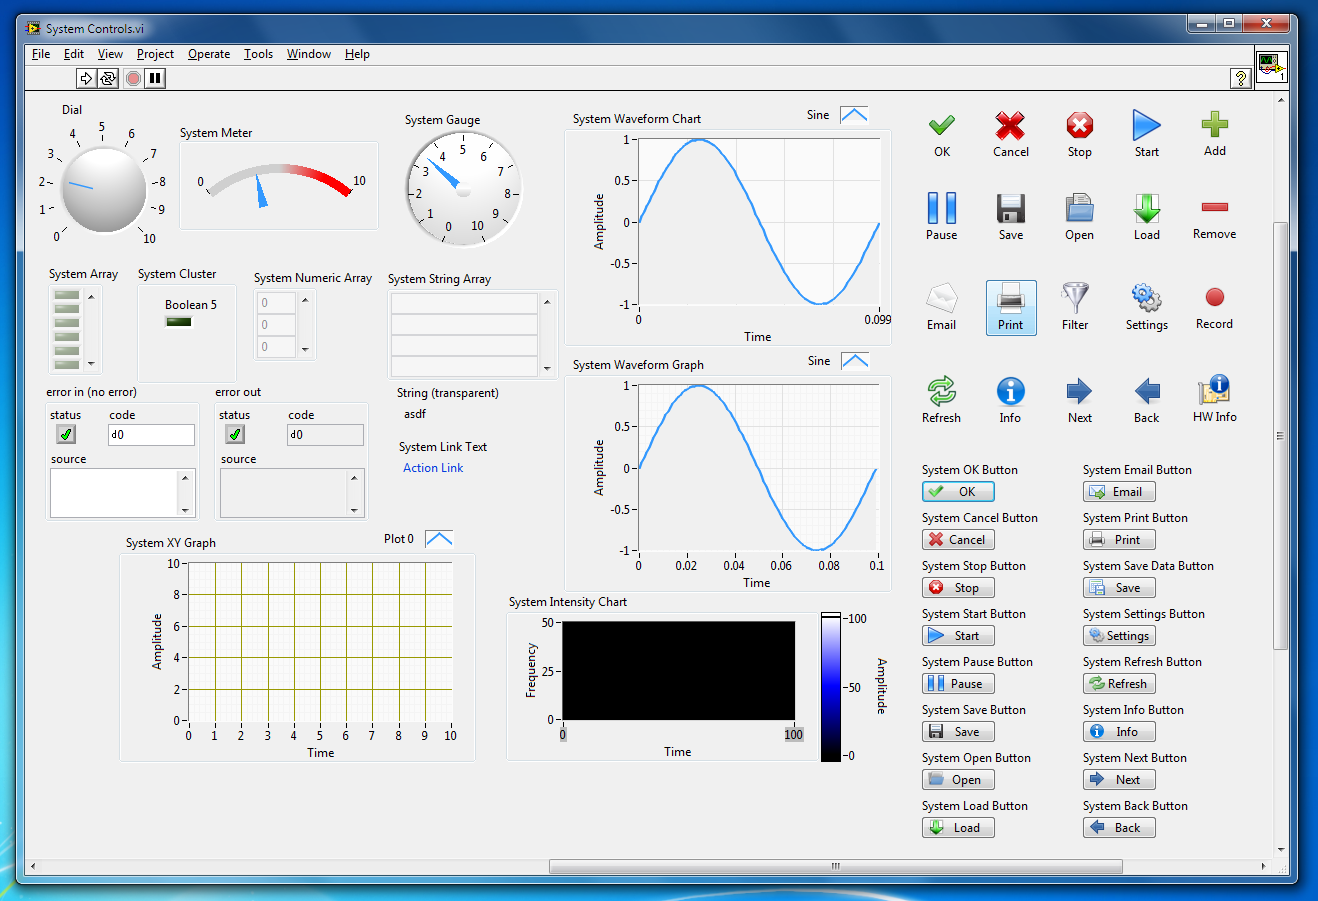
One of the first things I tell people who want to make "better" UIs in LabVIEW is to always use the System controls. System controls fit in well with the rest of the operating system and other programs that your user is familiar with. Good UIs help your user become comfortable faster. Familiarity breeds comfort etc. etc.
The one downside to this advice is that for some controls there is no System equivalent. There is no graph in the system palette since there is no defined graph control in Windows -- notice that system utilities such as Perfmon and Task Manager have visually different graphs. Clusters, arrays, error clusters, gauges etc. are other special LabVIEW control types that aren't common OS controls and as such aren't in the System palette.
Well, since the OS doesn't define how these controls should look, I decided to take a stab. Here is my effort to round out the System control palette with a number of the more specific LabVIEW controls customized to fit in well with the default OS controls (at least on Windows).
Credits:
- All the icons come from the Open Icon Library Project - http://openiconlibrary.sourceforge.net/
- I suppose I should credit Microsoft with the inspiration. For more design guidelines from MS I highly recommend reading their UX Guidelines found here - http://msdn.microsoft.com/en-us/library/aa511440.aspx
Installation Instructions:
Unzip the attached "Missing System Controls.zip" file in your <LabVIEW Install Directory>\menus\Controls\ folder and then restart LabVIEW to add all the above controls (and more) to your palette. Note: these controls were made in LabVIEW 2009.
or
Simply run the attached "Missing System Controls Installer.vi" -- this is a little experiment of mine. The VI contains all the .ctl file data stored as diagram constants and writes them to the appropriate files depending on which version of LabVIEW you select (currently only LV 2009 and the 2010 Beta would be supported since I wrote everything in LV 2009).
or
ni_ctl_system20-1.0.0-2.ogp contains the controls as a VI package installable with VI Package Manager.
Create Your Own Buttons!
If you like the iconized buttons and want more it's easy to create your own (although please share if you do create some). Grab some icons from the web (see link above) and watch this video to learn how:
[Note: The "Fake System Time Stamp.vi" is not part of this package - it's an experiment for someone in the Comment thread. Sorry if this is not the right place to attach it! - ChristinaR]
[Note: I added the "Missing System Graphs 1.vi" which attempts to update the "missing system style" graphs so their plot legends are not still in the Modern style. If I broke any of their functionality in the process, please let me know. - ChristinaR. Part 2: I added "Missing System Graphs 2.vi" which makes the Scale Format button on the Scale Legend a little bigger, to move the light off the decal]
[Note: I added "Missing System Array 1.vi" which has the index display changed to a system numeric. - ChristinaR]
[Note: I added "System Mixed Signal Graph.ctl" which is an attempt at a system-style mixed signal graph. - ChristinaR]
Software License
The code referenced in this document is distributed under the NATIONAL INSTRUMENTS SOFTWARE LICENSE TERMS (Sample Code License) - http://ni.com/samplecodelicense
- Mark as Read
- Mark as New
- Bookmark
- Permalink
- Report to a Moderator
Yeah that is where I installed from but still not seeing any license attached.
========
CLA and cRIO Fanatic
My writings on LabVIEW Development are at devs.wiresmithtech.com
- Mark as Read
- Mark as New
- Bookmark
- Permalink
- Report to a Moderator
The package info states the copywright is owned by NI, so unless otherwise stated the terms of use would be the same as any other NI licence
- Cheers, Ed
- Mark as Read
- Mark as New
- Bookmark
- Permalink
- Report to a Moderator
Copyright and license are two different things, and the NI Copyright does not imply anything about the license.
There was no license set for this code distribution. For the time being you should consider it to be distributed under the Sample Code License (ni.com/samplecodelicense) and I will work with Simon to add the license to the VIP. I added a note to the end of this document to this effect as well.
Christian L, CLA
Systems Engineering Manager - Automotive and Transportation
NI - Austin, TX
- Mark as Read
- Mark as New
- Bookmark
- Permalink
- Report to a Moderator
Christian_L wrote:
For the time being you should consider it to be distributed under the Sample Code License (ni.com/samplecodelicense) ...
Actually, since it wasn't distributed on NI.com (instead through the VIPM services and client app), we get to assume an implied license. If you apply an express license for future distributions, we'll be bound to it, but any existing distirbutions will still get their implied license.
- Mark as Read
- Mark as New
- Bookmark
- Permalink
- Report to a Moderator
Yes, feel free to assume the implied license for the current VIPM download. We want developers to use this code. The purpose of the express license is to provide a level of certainty for users who choose to develop commercial applications using these tools and redistribute the code. To quote from the article you linked to,
On the other hand, most authors would not think that posting a work automatically gives consent to commercial use of it without permission. This is not part of what one reasonably expects, and so it's not part of the implied license.
Christian L, CLA
Systems Engineering Manager - Automotive and Transportation
NI - Austin, TX
- Mark as Read
- Mark as New
- Bookmark
- Permalink
- Report to a Moderator
well done!!!
- Mark as Read
- Mark as New
- Bookmark
- Permalink
- Report to a Moderator
Hello,
Thanks for the great work. Since some time you can have a vertical Scrollbar for the graph legend.
Could someone change this scrollbar to system style? I need it only for the XY Graph.
Thanks
Sletrab
- Mark as Read
- Mark as New
- Bookmark
- Permalink
- Report to a Moderator
Hi
Great controls, I use them daily. But today, I miss the variant control (who don't even exist in silver). Could you help me?
Thanks
Nico
- Mark as Read
- Mark as New
- Bookmark
- Permalink
- Report to a Moderator
I see that now there is "UI Control Suite: System Controls 2.0" that can be installed through VIPM.
I did it, but the Mixed Signal Graph is missing 
Could you include this great control in the suite, please?
Could you fix some of the bugs on this controls (discussed above), please?
-------------------------------------------
In claris non fit interpretatio
-------------------------------------------
Using LV from 7
Using LW/CVI from 6.0
- Mark as Read
- Mark as New
- Bookmark
- Permalink
- Report to a Moderator
Christian_L wrote:
Yes, feel free to assume the implied license for the current VIPM download. We want developers to use this code. The purpose of the express license is to provide a level of certainty for users who choose to develop commercial applications using these tools and redistribute the code.
I am wondering about the license for the icon images used in these controls. The OP mentions that all icons are sourced from the Open Icon Library, however that library includes icons from a number of sources under a variety of open-source licenses. In particular, I am wondering if any of the icons used on these controls are covered under the GNU General Public License (GPL) since the GPL is a "copyleft" license which requires all work using using GPL-licensed material to also be licensed under a GPL-compatible license. If any of the icons used in these controls come from GPL-licensed icon packs, then theoretically any software that uses those controls are required to be released as open-source software.
Does anyone know if the icons in this pack are all sourced from non-GPL portions of the Open Icon Library?
- Mark as Read
- Mark as New
- Bookmark
- Permalink
- Report to a Moderator
I have a small issue with the Transparent String. When I turn it into an indicator, it gives me a little white box to the left of the text. Is this just me?

I did try to customize it but couldn't get rid of the little box, and didn't see a way to set it as Transparent. Since everything *else* is transparent, I couldn't hide it behind anything either.
- Mark as Read
- Mark as New
- Bookmark
- Permalink
- Report to a Moderator
I have an application plotting a rather large data set in a system UI XY graph. When I update the graph the CPU rises to ~16% for the application. I replaced the system XY-graph with the classic XY-graph and the CPU stays below 4%. However when using the system XY graph, if i disable the first plot (Plot 0 Visible = False) the CPU decreases to the value of the classic XY graph.
I also made a small application just plotting the XY-data, and i see the same result. With system XY and plot 0 visible the CPU is ~2.5%, disabling Plot 0 the CPU goes to 0.5% which is the same as plotting all data in the classic XY.
Is this a bug in the systen XY indicator? Or is there something wrong with mine?

- Mark as Read
- Mark as New
- Bookmark
- Permalink
- Report to a Moderator
It's because the first plot in the System graph is anti-ailiased. The rest of the plots are not, and neither is the first plot in the Classic graph. Click the legend item for plot 0 and uncheck "Anti ailiased" and it'll drop your CPU usage, likewise, enable Antiailiasing on your Classic graph and it'll increase your CPU usage.
- Mark as Read
- Mark as New
- Bookmark
- Permalink
- Report to a Moderator
Very late on this, but in regards to the white box that Bert mentioned when changing the Transparent String to an indicator, it is because of a leftover picture item. It seems like somewhere within the data of a System String, there are two picture items, one when it is a control and one when it is an indicator. If you go into the control and click the wrench to go into Customize Mode, you can see it there and you just have to upload a blank transparent image to fix it. Can't attach things here, but the fix was pretty easy once the cause was found.

Test Engineer at Moog Inc.
Saying "Thanks that fixed it" or "Thanks that answers my question" and not giving a Kudo or Marked Solution, is like telling your waiter they did a great job and not leaving a tip. Please, tip your waiters.
- « Previous
- Next »
