- Document History
- Subscribe to RSS Feed
- Mark as New
- Mark as Read
- Bookmark
- Subscribe
- Printer Friendly Page
- Report to a Moderator
- Subscribe to RSS Feed
- Mark as New
- Mark as Read
- Bookmark
- Subscribe
- Printer Friendly Page
- Report to a Moderator
Contact Information
University: University of Ngaoundere
Team Members (with year of graduation): (1) CHE Conrad Toah, (2) Jinya Sylvie Awungjia, (3) Derick Samjeila Ewang
Faculty Advisers:
Email Address:
Submission Language
Project Information
Title: Production of Bioethanol from Banana Stem
Description:
Design Architecture
Bioethanol is fermentation alcohol, that is, it refers to ethyl alcohol produced by microbial fermentation processes as opposed to synthetically produced ethanol from petrochemical sources. It is produced through distillation of ethanolic waste emanating from fermentation of biomass derived sugars (Graeme, 2010). Ethanol is the most widely used liquid biofuel. It can be utilised as liquid fuel in internal combustion engines, either neat or in blends with petroleum (Graeme, 2010).
Currently, around 85 percent of the global production of liquid biofuels is in the form of ethanol. The two largest ethanol producers, Brazil and the United States of America, account for almost 90 percent of total production, with the remainder accounted for mostly by Canada, China, the EU (mainly France and Germany) and India
I.2.1.1-First generation feedstocks
In general, bioethanol can be extracted from every sort of carbohydrate material that has the general formula (CH2O) n.
First generation biofuels for ethanol production refer to plant biomass (phytomass) sources that are also sources of human and animal nutrition, namely: cereal starches and sugar crops. Table 4 summarises both first and second generation resources for bioethanol production.
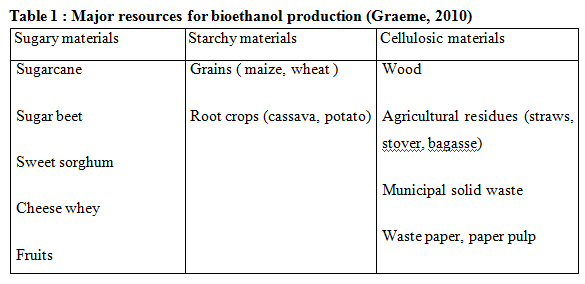
I.2.1.2-Second generation feedstocks (Cellulose based).
The use of second generation feedstocks to meet growing demands for future biofuel production is ultimately unsustainable and there are several limitations to starch and sugar based ethanol production (Graeme, 2010).
The three main components of lignocellulosic biomass are cellulose, hemicellulose, and lignin. Cellulose and hemicellulose can be hydrolysed with chemicals and/or enzymes to monomeric sugars, which can subsequently be converted biologically to biofuels (Caye et al., 2008).
I.2.2-Composition of Natural cellulosic Feedstocks
- Cellulose
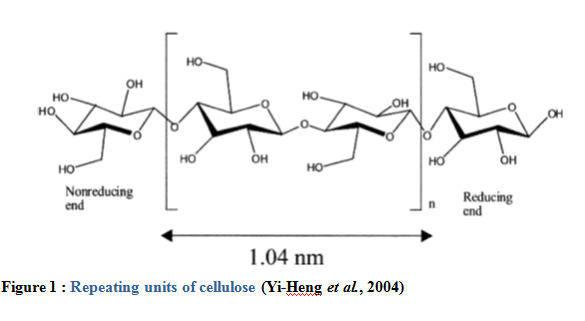
As the most abundant organic substance on earth, cellulose is one of the most studied chemical compound on earth (Fiechter, 1981). Found in the cell wall of all plants, cellulose is reported as the structural component of plants. It consists of linear β-1,4-linked D-glucopyranose residues with a degree of polymerization up to at least 15000 without branches. Hydrogen bonds between cellulose molecules enable the neighbouring parallel or anti-parallel linear chains to become condensed to form an extremely long and thin structure hence building up the main microfibrillar phase (Brett and Waldron, 1996; Vries and Visser, 2001). The crystalline structure of cellulose chain gives rise to its considerable tensile strength with minimal flexibility and water insolubility. Therefore, it is fairly resistant to biological attack, which is a major limitation to cell wall hydrolysis (Gray et al., 2006).
Hemicellulose
Hemicellulose is the second abundant polysaccharide in plant cell wall, constituting about 20-35% of the plant materials (Saha, 2003). Unlike the comparatively uniform composition of cellulose, hemicellulose varies tremendously among different cell types and species. Also, the degree of branching and the characteristic of the minor sugars within hemicellulose differ from
plant to plant (Gray et al., 2006). But for a certain plant, there is usually one kind of hemicellulose that is predominant (Brett and Waldron, 1996). The major hemicellulose in cereals and hardwood is xylan, (Vries and Visser, 2001). Xylan generally contains a backbone of β-1, 4- linked xylose residues. This structure is occasionally substituted by α-linked 4-O-methylglucironic acid on C2, α-linked arabinose or acetyl esters on C2 or C3 of some xylose residues (Brett and Waldron, 1996). Hemicellulose non-covalently links onto cellulose with hydrogen-bonds and its C-5 sugar ring, which shows an asymmetric configuration, assists celluloses to form the liquid crystalloid (Vincent, 1999). However, xylan itself does not have a crystalline structure because it lacks the ability to form hydrogen bonds between neighbouring polysaccharide chains. Within some plant cell walls, cellulose and xylan are in nearly the same amount; but since xylan is able to form hydrogen bonds only on one side, just one half of xylan could be found to directly interact with cellulose, which
assists in constructing the structural backbone for the plant cell wall. This kind of intersection is sometimes identified as the sheathing of cellulose by hemicellulose, which is also considered an impediment for cellulose digestion (Neville, 1993; Brett and Waldron, 1996).
- Lignin
Certain differentiated cell types contain lignin, the most abundant aromatic polymer in nature that is gradually laid down when cell elongation occurs and normally constitutes about 10-25% of the plant material (Zaldivar et al., 2001; Saha, 2003). Three different alcohols are precursors for lignin synthesis ρ-Hydroxyphenyl alcohol, guaiacyl alcohol and syringyl alcohol. They link with each other by a wide variety of bonds to form a huge network in the final phenolic compound (Brett and Waldron, 1996; Sakakibara, 1980). In addition, the lignin
network continues to expand as long as the precursors are available, hence filling up the spaces that have not been occupied by other components and greatly replacing water. Within the complicated meshwork, lignin has a considerable impact on other existing links. The most important effect is the enhancement of the strength of hydrogen-bonds between polysaccharides, which in turn increases the stability and rigidity of the cellulose hemicellulose structure. This type of protection successfully reduces the chance of penetration of wall-degrading enzymes, and serves as an effective barrier to pests and diseases to protect the plant body (Brett and Waldron, 1996). However, this protection is not preferred in bioprocessing since it limits enzyme accessibility to the internal polysaccharides.
I.2.3-Conversion of Cellulosic Biomass to Ethanol
Although various bioconversion processes are employed for cellulosic biomass, a general process involves four main steps: size reduction and pretreatment, hydrolysis, and fermentation. The feedstock matrix becomes more accessible to enzymes after pretreatment; and polysaccharides, mainly cellulose, can be broken down to reducing sugars which are the substrate for microbial fermentation. Finally, purification in terms of distillation and dehydration is needed to meet fuel market requirement. Cellulose is the component of prime interest and can be chemically (by acid) or enzymatically hydrolyzed to glucose which is the major substrate in ethanol fermentation. Hemicellulose has a less compact structure than cellulose and can be significantly degraded or solubilized during pretreatment. If hemicellulose is successfully removed from the complex and degraded to oligo or mono xylose, these smaller molecules can be further converted to other by-products. Within the complicated meshwork, lignin has a considerable impact on other existing links. The most important effect is the enhancement of the strength of hydrogen-bonds between polysaccharides, which in turn increases the stability and rigidity of the cellulose-hemicellulose structure. This type of protection successfully reduces the chance of penetration of wall-degrading enzymes, and serves as an effective barrier to pests and diseases to protect the plant body (Brett and Waldron, 1996). However, this protection is not preferred in bioprocessing since it limits enzyme accessibility to the internal polysaccharides.
I.2.3.1-Pretreatment
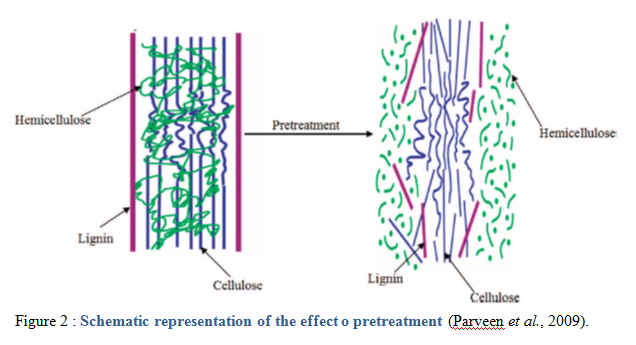
Pretreatment methods refer to the solubilisation and separation of one or more of the
major components of biomass (hemicellulose, cellulose, lignin,) to make the remaining solid biomass more accessible to further chemical or biological treatment. Hydrolysis (saccharification) breaks down the hydrogen bonds in the hemicellulose and cellulose fractions into their sugar components: pentoses and hexoses. These sugars can then be fermented into bioethanol (Graeme, 2010). An ideal biomass pretreatment process should meet the following requirements:
• High rates of hydrolysis and high yields of fermentable sugars
• Minimal degradation of the carbohydrate fractions
• No production of compounds that are inhibitory to microorganisms used in the subsequent fermentation step
• Inexpensive materials of construction
• Mild process conditions to reduce capital costs
• Recycle of chemicals to reduce operating costs
• Minimal wastes
There currently is no single pretreatment process that meets all of the above requirements. In selection of a pretreatment process, all of the above requirements should be considered (Caye et al., 2008). A number of physical and/or chemical methods can be used to separate cellulose from its protective sheath of lignin and increase the surface area of the cellulose crystallite by size reduction and swelling (Roehr, 2001).
a) Physical Pretreatment
Physical pretreatment includes mechanical comminution, steam explosion microwave, radiation etc (Ying, 2008).
- Mechanical comminution
Mechanical comminution can result in significant changes in the physical characteristics of biomass, including smaller size, as well as a lesser degree of both crystallinity and polymerization. It has been widely applied in the corn-to-ethanol process, making corn kernels more open to enzymatic hydrolysis (Kim and Dale, 2002). Lignocellulosic biomass, however, requires much more mechanical energy input than corns, thus making comminution a less economically competitive approach for ethanol production (Graf and Koehler, 2000). Although power input for this process greatly depends on the final size requirement and the physical characteristic of the selected feedstock (Sun and Cheng, 2002), generally speaking,
the energy requirement for comminution is significant.
- Steam explosion (autohydrolysis)
Steam explosion provides swift thermal expansion which opens up the structure of the target biomass. It is recognized as a suitable pretreatment method for hardwoods and agricultural residues, but less effective for softwoods (Ying, 2008). This kind of pretreatment is typically initiated at a temperature of 160-260 °C (corresponding pressure 0.69-4.83 MPa) and the residence time varies from seconds to a few minutes (Sun and Cheng, 2002). The main factors affecting the results of steam explosion are residence time, temperature, particle size as well as moisture content (Duff and Murray, 1996 ). In addition, since steam explosion is a chemical-free process, no environmental cost in terms of chemical recycling is needed, thus reducing the operating cost. However, during the steam explosion process, some intermediate compounds generated are inhibitory to subsequent processes such as microbial fermentation (Mackie et al., 1985). Therefore, a water wash is usually applied to solve this problem, although some of the soluble sugars may also be washed off during this step (McMillan, 1994). Recent literature has indicated a growing interest in introducing dilute-acid impregnation before steam explosion to promote the performance of pretreatment. In such a process, steam explosion is modified to be coupled with SO2 catalysis by impregnating the substrate with SO2 prior to the standard process (Tengborg et al., 1998). Dilute acid-added steam explosion can solubilize a significant amount of hemicellulose component in lignocellulosic feedstocks thus improving enzyme accessibility to
cellulose during hydrolysis. In general, pretreatment temperature ranges from 140 to 180 °C for normal feedstock treatments. Higher temperature with shorter residence time results in enhanced hemicellulose removal and thus a better enzymatic cellulose digestibility as shown in studies on corn stover (Melvin et al., 2003).
- Microwave
The principle of microwave pretreatment relies on the effect of temperature. Since the temperature required is usually above 160-180°C, it is sufficient to soften the main components of the cell wall and decrease the crystallinity of cellulose. Former studies using rice straw have verified the effects that microwave could change the crystalline structure of cellulose, degrade lignin and hemicellulose, thus increasing the enzymatic accessibility (Kitchaiya et al., 2003; Zhu et al., 2005). But elevated temperatures may also cause some useful components in the feedstock to decompose. Therefore, microwave pretreatment has been studied in conjunction with chemical reagents for pretreatment at lower temperature while maintaining effective results (Zhu et al., 2005; Keshwani et al., 2007) investigated the effect of microwave pretreatment on switchgrass and indicated that higher enzymatic hydrolysis efficiencies could be obtained when pretreatment was performed at lower power levels. The greatest yield of reducing sugars was observed during microwave exposure of switch grass immersed in 3% (w/v) sodium hydroxide solution for 10 minutes at 250 watts. However, this approach is currently limited to lab studies due to cost and safety concerns.
- Radiation
Radiation is another physical method with the objective of achieving the expected degree of both polymerization and reactivity of cellulose using α-ray or electronic ray. Pretreatments of wheat straw using an electron beam accelerator in the presence of peracetic acid solutions were carried out by Lu and Kumakura (1995) for investigation of the effect of radiation. It was proposed that as the irradiation dose increased to 500 kGy (KiloGray) or above, pretreatment with a combination of peracetic acid and irradiation can significantly enhance enzymatic hydrolysis. Yang et al., (2008) studied the effect of γ radiation pretreatment on enzymatic hydrolysis of wheat straw and indicated that glucose yield increased with elevated irradiation doses and achieved the maximum (13.4%) at 500 kGy. However, radiation, like microwave pretreatment, is currently limited to lab scale because of its considerable cost and security concerns.
b) Chemical pretreatment
Chemical pretreatment, mainly employing chemical agents such as acids and alkalis, can enhance hydrolysis and improve glucose recovery from cellulose because of the removal of hemicellulose or lignin (Mosier et al., 2005). However, anti-corrosion equipment and chemical recycling are required if such processes are scaled up.
- Acid Pretreatment
The use of concentrated acid, especially sulphuric acid, for cellulose hydrolysis has been known for a long time. The process developed by Arkenol by far has the best chance of reaching commercialization. In this process, decrystallisation of cellulose and hemicellulose is carried out by adding 70 to 77 percent sulphuric acid to a biomass that has been dried to 10 percent moisture and the temperature is maintained at about 50°C. The concentrated acid disrupts the hydrogen bonding between cellulose chains and converts it to an amorphous state, which is extremely susceptible to hydrolysis. Dilution of the acid to 20 to 30 percent will cause hydrolysis of both cellulose and hemicellulose to monomeric sugars. The hydrolysate is separated from the residual biomass by pressing. The partially hydrolyzed biomass then undergoes a second hydrolysis, which uses conditions similar to the first one. This second hydrolysis releases the rest of the sugars.
Dilute acid pretreatment has been well developed recently to successively avoid problematic issues with toxicity, acid recovery and anti-corrosion equipment maintenance associated with concentrated acid pretreatment (Sivers and Zacchi, 1995; Sun and Cheng, 2002). The main function of dilute acid pretreatment is to effectively remove the hemicellulose sheathing over cellulose, while at the same time loosening the structure of lignin and decreasing the crystallinity of digestible cellulose. The dissolved hemicellulose in the liquid phase is removed from the solid biomass residues and may be separately hydrolyzed to xylose and other 5C or 6C sugars, or eventually broken down to furfural (Mosier et al., 2005). Furfural can be recovered from distillation and is widely applicable in the field of industry mainly as a solvent in petrochemical refining (Paturau, 1987). It is reported that glucose yield subsequent to complete removal of hemicellulose can reach as high as 100% (Knappert et al., 1981). During acid pretreatment, two reactions occur simultaneously relative to lignin: degradation and accumulation (Pearl, 1967); therefore, the changes in lignin content greatly depend on which reaction is stronger. Although lignin removal is not significant in acid pretreatment, it has been stated that the structure of lignin is interrupted thus making the carbohydrates more accessible to enzymes (Yang and Wyman, 2004).
- Alkali Pretreament
Alkali pretreatment is conducted under milder conditions at lower temperature and pressure compared with acid pretreatment. However, alkali pretreatment is much more time consuming and the reaction time greatly depends on the operation temperature selected (Mosier et al., 2005; Wyman et al., 2005). The major effect of alkali pretreatment is the saponification of intermolecular ester bonds which crosslink lignin and carbohydrates, thus increasing porosity and internal surface area of the biomass matrix as well as decreasing the degree of crystallinity of cellulose (Sun and Cheng, 2002). Lignin can also be disrupted and removed from the biomass matrix, resulting in improved susceptibility of the remaining
polysaccharides to enzyme attack during hydrolysis. One limitation related to alkali pretreatment is the formation of unrecoverable salts within the biomass feedstock (Mosier et al., 2005). Bases such as sodium hydroxide, potassium hydroxide, and ammonia can be used for biomass pretreatment. Base solutions cause swelling of biomass, which subsequently leads to decrease in the degree of polymerization, decrease in crystallinity, disruption of the lignin structure, and separation of structural linkages between lignin and carbohydrates.Among the bases investigated, ammonia has the highest potential for use in commercial processes since it can be recovered and recycled due to its high volatility. Thus, it reduces chemical cost and waste treatment cost (Caye et al., 2008).
- Cellulose solvent
Cellulose solvent is another chemical additive used for pretreatment (Mosier et al., 2005). This kind of solvent, such as alkaline H2O2, ozone, and glycerol, can disrupt the structure of cellulose within biomass feedstocks thus improving the enzyme digestibility during hydrolysis (Ladisch et al., 1978; Wood and Saddler. ., 1988). After pretreatment by cellulose solvent, cellulose is released into the liquid phase with a decreased crystallinity and looser interaction with hemicellulose and lignin, which is advantageous to the subsequent hydrolysis. However, these chemical additives are too expensive to be used at a large scale. Solvent recycle is normally required to make this approach economically feasible (Mosier et al., 2005).
c) Biological pretreatment
Biological pretreatment utilizes microbial metabolism or genetic modification as well as enzymes to remove lignin or hemicellulose from the plant cell wall. Compared with physical or chemical processes, biological pretreatment involves more complicated reactions and is more time-consuming (Godliving, 2009).
- Microbial digestion
In biological pretreatment, microorganisms, mostly fungi, are used to digest lignin and hemicellulose in waste materials (Schurz, 1978). White-rot fungi such as Pleurotus ostreatus and Pycnoporus cinnabarinus 115 are preferred for biological pretreatment because of its high efficiency in degrading or modifying the lignin content in lignocellulosic biomass (Hatakka, 1983). Besides, some modifications have been made to fungal cultivation to improve the digestion of lignin and avoid degradation of cellulose. For example, construction of fungal mutants with weaker cellulase-producing ability has been tested to be applicable (Ander and Eriksson, 1977); restricting the availability of certain nutrients which are necessary for normal metabolism of fungi is also an effective approach which leads to the production of expected lignolytic enzymes useful in lignin digestion (Godliving, 2009).
Use of enzymes
Enzymatic pretreatment of Ligno cellulosic waste utilize hydrolytic and oxidative enzymes which are mainly derived from fungi and bacteria Lignolytic enzymes are primarily involved in lignin degradation in oxidative reactions that are mainly free radical driven in the presence (or sometimes absence) of mediators. The main enzymes involved are lignin peroxidase, manganese peroxidase and laccase. The hydrolytic and oxidative enzymatic reactions are mainly carried out at 30 - 45°C with low enzyme loading rate at reaction time of 6 - 26 h (Godliving, 2009).
- Ensiling
Silage is a traditional technology used to preserve large quantities of cellulosic materials harvested for storage in a year-round system. Through the ensiling process, the rate of carbohydrate degradation is strictly controlled by creating a disadvantageous anaerobic environment in which microbes favour acetic and lactic acid fermentation. Therefore, pH is greatly reduced within the system (Ren, 2006).
I.2.3.2- Hydrolysis
Hydrolysis of cellulose can be effectively catalysed by both the acid "and the cellulose enzyme (Fiechter, 1981).
a) Acid Hydrolysis
Acid hydrolysis may be categorized under two general approaches, that of high acid concentration at a low temperature or that of low concentration at a high temperature. The relative advantages/disadvantages of each stem from a trade-off between an increased rate and overall yield of hydrolysis vs. the degradation of glucose to undesirable by-products
( Roehr, 2008).
- Concentrated Acid Hydrolysis
Crystalline cellulose is completely soluble in 72% H2SO4 or 42% HC1 solutions at relatively low temperatures (10-45 °C) (Oshima, 1965).The polymer is depolymerized to yield oligosaccharides, the bulk of which is cellulotetraose. Little, if any, glucose monomers are released at this stage. After dissolution in the concentrated acid, the oligomer mixture is then diluted to a lower concentration and heated to about 100-200 °C for 1-3 h. This step converts oligomeric glucose chains to their monomeric constituents.
While concentrated acid hydrolyses cellulose rapidly with little or no requirement
for pretreatment, the yield of fermentable sugars is usually quite low due to degradation of the glucose as it is released from the polymer. Dilute acid processes yield less degradation products, however, the rate of hydrolysis is lower due to the effect of the resistant crystalline regions within cellulose.
- Dilute Acid Hydrolysis
While concentrated acid hydrolyses cellulose rapidly with little or no equipment for the yield of fermentable sugars is usually quite low due to degradation of the glucose as it is released from the polymer. Dilute acid processes yield less degradation product, however, the rate of hydrolysis is lower due to the effect of the resistant crystalline regions within cellulose (Roehr, 2010).
b) Enzymatic Hydrolysis
Enzymatic hydrolysis is attractive since it is possible to yield fermentable sugars from holocellulose at near theoretical levels under mild conditions, which is important to economic feasibility (Wyman et al., 2005). However, enzymes used in the process of cellulosic biomass conversion need to be more effective and economical in order to be cost-competitive with traditional ethanol product derived from corn and sugarcane (Gray et al., 2006).
Enzymatic hydrolysis of cellulose to ethanol is performed by a class of enzymes termed cellulases (Stevens, 1984). Each component of the cellulase multienzyme system plays a particular catalytic role in the depolymerisation of cellulose to glucose monomer units.
Different kinds of "cellulases" may be used to cleave the cellulose and hemicelluloses. This enzyme complex consists of an endo-β-(1→4)-glucanase (Cx-cellulase) and an exo-β-(1→4)-glucanase (cellobiohydrolase). The Cx-cellulase breaks the bonds in the amorphous regions of the cellulose molecules, and the cellobiohydrolase removes cellobiose from the nonreducing ends. The combined action of the two enzymes causes the degradation of cellulose. Another enzyme, called cellobiase [β-(1→4)-glucosidase] is required to hydrolyse cellobiose to glucose. This enzyme is excreted by fungi and a number of aerobic bacteria growing on cellulose. Industrial cellulases already contain some cellobiase activity but normally at relatively low levels. Therefore, in enzymatic hydrolysis of biomass, a cellobiase needs to be added to ensure high yields of glucose.
Enzyme hydrolysis of hemicellulose is much more complex. Complete breakdown of this heterogeneous biopolymer requires the action of several hydrolytic enzymes. These enzymes collectively are called hemicellulases and consist of endo-enzymes, which cleave internal glycosidic bonds, exo-enzymes, which remove sugar residues from the nonreducing ends, and esterases, which attack nonglycosidic ester linkages. The hemicellulose hydrolytic enzymes include endo-β-1,4-xylanase, exo-β-D-xylosidase, α-L-arabinofuranosidase, endo- 1,5-α-L-arabinanase, α-glucuronidase, acetyl esterases, which consist of acetylxylan esterase and acetyl esterase, and phenolic acid esterases, which consist of feruloyl esterase and p-coumaroyl esterase.
Commercial cellulases normally also contain hemicellulose activities. In fact, the hemicellulose in pretreated corn stover has been routinely hydrolyzed to 70 to 80 percent theoretical yield with commercial cellulases. However, because of their complex nature, not all biomass hemicelluloses can be effectively hydrolyzed with commercial enzymes as in the case of corn stover. The best strategy for complete hydrolysis of corn fiber to fermentable sugars is to use dilute sulfuric acid under relatively mild conditions, for example 0.25 percent acid by weight for 1 h at 121°C, to hydrolyze the hemicellulose fraction, then using commercial cellulases to hydrolyze the cellulose in the residual solids (Caye et al., 2008).
Trichoderma reesei is reported to contain two enzymes each of the first two categories, exoglucanase and cellobiase with the respective genes, and there is less data regarding
the number of β-glucosidases. The purification and characterization of these proteins has been carried out with a number of organisms from different sources. It is difficult to generalize on the physical properties of the enzymes since they are subject to a high degree
of variation. Their molecular weights commonly range from 12,000-80,000 with /3 glucosidase generally being the larger macromolecule (Roehr, 2010).
Cellulases are induced enzymes and are produced only when the organism is grown in the presence of cellulose, cellobiose, lactose, sophorose, or other glucans which contain /3-(l,4) linkages). These enzymes are also highly regulated by end-product inhibition. This phenomenon has led to interest in the continuous removal of hydrolysis products during their formation. Denaturation by shearing is a common drawback of cellulose enzymes (Reese and Robbins, 1981), especially at air-liquid interfaces (Kim et al., 1982). Stabilizing agents such as surfactants are effective in reducing the extent of this deactivation.
Factors affecting enzymatic hydrolysis
Enzymatic hydrolysis is affected by a variety of factors, including properties of substrates, enzyme activities and reaction conditions such as pH, temperature, time, etc . The characteristics of the biomass substrate are of great importance to hydrolysis optimization. The susceptibility of cellulosic substrates to cellulases mainly depends on the degree of crystallinity and polymerisation of cellulose, availability of the surface area as well as lignin content (Sun and Cheng, 2002).
Enzyme loading is another factor which is crucial to hydrolysis efficiency. Because the amount of enzyme directly affects the operating cost, simply increasing enzyme loading is not a reasonable approach to facilitate the reaction and improve sugar yields. Gregg and Saddler (1996) suggested that cellulase dosage of 10 FPU/g cellulose is practical for lab-scale research since it is sufficient to provide great glucose yield within an acceptable duration at a reasonable cost. Lloyd and Wyman (2005) experimented on enzyme loading to investigate its effect on hydrolysis of the pretreated corn stover. They chose four enzyme loadings of 3, 7, 15 and 60 FPU respectively of Spezyme CP/g original glucan in the pretreated solids with Novozym 188 added at a ratio of 2:1 CBU to FPU. The experiment result obtained after
digestion showed that reduction in sugar yields was not directly correlated to the reduction in enzyme loading. Less than 1% decrease in total reducing sugar (glucose and xylose) yield was observed when the enzyme loading was decreased from 60 to 15 FPU/g original glucan and about 3% reduction was with a decrease from 60 to 7 FPU/g original glucan. In addition, Chen et al, (2007) reported that no significant enhancement in glucan conversion was observed when increasing the enzyme loading from 40 FPU/g glucan to 60 FPU/g glucan. Therefore, if two different enzyme loadings do not make a statistical difference in final glucose yields, the lesser enzyme dosage is preferred. Relative to xylan conversion, since cellulase and cellobiase also contain certain xylanolytic activity, the addition of xylanase does not always lead to an improvement in xylan-to-xylose conversion during enzymatic hydrolysis (Saha et al., 2005a; Chen et al., 2007).
I.2.3.3-Fermentation
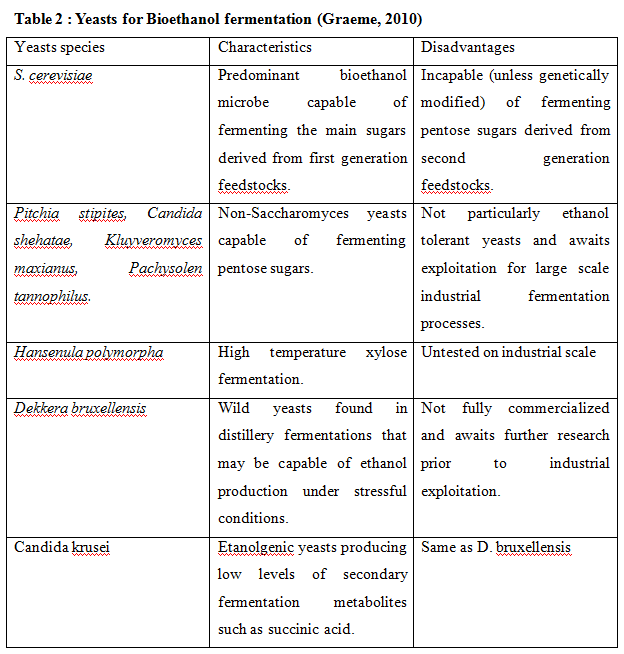
Hydrolysis of lignocellulosic biomass generates a mixture of sugars, which includes glucose, xylose, arabinose, galactose, and mannose, with glucose, xylose, and arabinose being the most predominant ones. Unfortunately, the yeast Saccharomyces cerevisiae, which is used for industrial ethanol production from sugar and starch feedstocks, can only metabolize glucose to ethanol under anaerobic conditions. Therefore, many attempts have been made to develop microorganisms that can metabolize other sugars in addition to glucose and convert them to ethanol at high yields and rates (Caye et al., 2008).
- Microbes for Fermentation
The yeast Saccharomyces cerevisiae is the predominant industrial microorganism responsible or alcoholic fermentation. In addition to S. cerevisiae, non-Saccharomyces yeasts have potential in bioethanol fermentation processes.
- Principles of Ethanol Fermentation
The EMP (Embden-Meyerhoff-Parnas) pathway (Dien et al., 2003). The EMP is the most common reaction for oxidizing glucose to pyruvate which is an important intermediate metabolite for most living organisms. The EMP pathway is composed of three stages, namely activation of glucose, hexose splitting and energy extraction.
2 ATP + glucose + 4 ADP + 2Pi + 2 NAD+ → 2 ADP + 2 pyruvate + 4 ATP + 2 NADH +2H
Ethanol is formed as an end product of the EMP pathway. First, acetaldehyde is produced from pyruvate by reducing a molecule of CO2 out of pyruvate, and then acetaldehyde is reduced to ethanol along the redox reaction between NADH and NAD+. Besides ethanol, lactic acid is another end product of microbial fermentation. Since certain types of inhibitors are formed during acid pretreatment such as acetic acid, furfural, and lignin-derived compounds (Sreenath and Jeffries, 2000), commercial organisms capable of fermenting reducing sugars must be able to function normally in the large-scale environment and tolerate various toxic compounds contained in the hydrolyzate (Gray et al., 2006).
Technological Configurations
The classic configuration employed for fermenting biomass hydrolyzates involves a sequential process where the hydrolysis of cellulose and the fermentation are carried out in different units. This configuration is known as separate hydrolysis and fermentation (SHF). In the alternative variant, the simultaneous saccharification and fermentation (SSF), the hydrolysis and fermentation are performed in a single unit. The most employed microorganism for fermenting lignocellulosic hydrolyzates is S. cerevisiae, which ferments the hexoses contained in the hydrolyzate.
Separate Hydrolysis and Fermentation (SHF)
When sequential process is utilized, solid fraction of pretreated lignocellulosic material undergoes hydrolysis (saccharification). This fraction contains the cellulose in an accessible form to acids or enzymes. Once hydrolysis is completed, the resulting cellulose hydrolyzate is fermented and converted into ethanol. One of the main features of the SHF process is that each
step can be performed at its optimal operating conditions. The most important factors to be taken into account for saccharification step are reaction time, temperature, pH, enzyme dosage, and substrate load (Sánchez and Cardona, 2007).
Simultaneous Saccharification and Fermentation (SSF)
The SSF process has been extensively studied to reduce the inhibition of end products hydrolysis (Julian et al). In the process, reducing sugars produced in cellulose hydrolysis or saccharification is simultaneously fermented to ethanol, which greatly reduces the product inhibition to the hydrolysis. However, the need of employing more dilute media to reach suitable rheological properties makes the final product concentration to be low. In addition, this process operates at non optimal conditions for hydrolysis and requires higher enzyme dosage, which influences substrate conversion positively, but process costs negatively. Considering that enzymes account for an important part of production costs, it is necessary to find methods reducing the cellulases doses to be utilized (Sánchez and Cardona, 2008).
The microorganisms used in the SSF are usually the fungus Trichoderma reesei and S. cerevisiae. Hydrolysis is usually the rate-limiting process in SSF (Philippidis and Smith, 1995). Thermotolerant yeasts and bacteria have been used in the SSF to raise the temperature close to the optimal hydrolysis temperature. Ballesteros et al, (1991) have identified Kluyveromyces marxianus and K. fragilis that have the highest ethanol productivity at 42 °C from a number of yeast strains. K. marxianus has an ethanol yield of 0.5 g/g cellulose in 78 h using Solka Floc 200 as substrate at 42 °C (Ballesteros et al, 1991). SSF has some advantages such as increase of hydrolysis rate by conversion of sugars that inhibit the cellulase activity, lower enzyme requirement, higher product yield, lower requirements for sterile conditions since glucose is removed immediately and ethanol is produced, shorter process time and less reactor volume because a single reactor is used. However, ethanol may also exhibit inhibition to the cellulase activity in the SSF process. Some disadvantages of this configuration include incompatible temperature of hydrolysis and fermentation, ethanol tolerance of microbes, and inhibition of enzymes by ethanol.
I.2.3.4-Alcohol Recovery ( Caye et al., 2008)
The recovery of ethanol from fermented media is predominantly by distillation. Basically, alcohol distillation refers to the separation of ethanol from a binary alcohol-water mixture based on their different boiling points and there are some common fundamental principles that pertain to all alcohol distillation systems:
- A dilute ethanolic solution is fed into the system.
- Heat directly enters the base of the column
- The purified product with lower boiling point ( i.e. ethanol) is vapourised
- The higher boiling point product (i.e. dilute aqueous stillage) is removed at the bottom of the column
- A water-cooled heat exchanger condenses the alcohol vapour
- The condensate is split into two streams , one is the desired product and the other is the reflux which is returned to the top of the column

I.3-THE BANANA PLANT
I.3.1-Description
Banana is the common name for herbaceous plants of the genus Musa and for the fruit they produce. Bananas come in a variety of sizes and colours when ripe, including yellow, purple, and red. In popular culture and commerce, "banana" usually refers to soft, sweet "dessert" bananas. By contrast, Musa cultivars with firmer, starchier fruit are called plantains. Many varieties of bananas are perennial.
Banana is the common name for herbaceous plants of the genus Musa and for the fruit they produce. Bananas come in a variety of sizes and colors when ripe, including yellow, purple, and red. In popular culture and commerce, "banana" usually refers to soft, sweet "dessert" bananas. By contrast, Musa cultivars with firmer, starchier fruit are called plantains. Many varieties of bananas are perennial. The banana plant is the largest herbaceous flowering plant. Plants are normally tall and fairly study and are often mistaken for trees, but their main or upright stem is actually a pseudostem that grows 6 to 7.6 meters tall, growing from a corm. Each pseudostem can produce a single bunch of banana. After fruiting, the pseudostem dies, but offshoots may develop from the base of the plant. Leaves are spirally arranged and may grow 2.7 meters long and 60 cm wide. They are easily torn by the wind, resulting in the familiar frond look. Each pseudostem normally produces a single influorescence, also known as the banana heart. The influorescence contains many bracts (sometimes incorrectly called petals) between rows of flowers. The female flowers (that can develop into fruit) appear in rows further up the stem from the rows of male flowers. The ovary is inferior, meaning that the tiny petals and other flower parts appear at the tip of the ovary (FAO, 2007).
Banana fruit develop from the banana heart, in a large hanging cluster, made up of tiers (called hands) with up to 20 fruit to a tier. The hanging cluster is known as a bunch, comprising 3–20 tiers, or commercially as a "banana stem", and can weigh from 30–50 kilograms. In common usage, bunch applies to part of a tier containing 3-10 adjacent fruits (FAO, 2007).
Common name: Banana
Family: Musaceae
I.3.2-Cultivation
All widely cultivated bananas today descend from the two wild bananas Musa acuminata and Musa balbisiana. While the original wild bananas contained large seeds, diploid or polyploid cultivars (some being hybrids) with tiny seeds are preferred for human raw fruit consumption.[34] These are propagated asexually from offshoots. The plant is allowed to produce two shoots at a time; a larger one for immediate fruiting and a smaller "sucker" or "follower" to produce fruit in 6–8 months. The life of a banana plantation is 25 years or longer, during which time the individual stools or planting sites may move slightly from their original positions as lateral rhizome formation dictates.
Cultivated bananas are parthenocarpic, which makes them sterile and unable to produce viable seeds. Lacking seeds, propagation typically involves farmers removing and transplanting part of the underground stem (called a corm). Usually this is done by carefully removing a sucker (a vertical shoot that develops from the base of the banana pseudostem) with some roots intact. However, small sympodial corms, representing not yet elongated suckers, are easier to transplant and can be left out of the ground for up to two weeks; they require minimal care and can be shipped in bulk.
It is not necessary to include the corm or root structure to propagate bananas; severed suckers without root material can be propagated in damp sand, although this takes somewhat longer.
In some countries, commercial propagation occurs by means of tissue culture. This method is preferred since it ensures disease-free planting material. When using vegetative parts such as suckers for propagation, there is a risk of transmitting diseases (especially the devastating Panama disease).
As a non-seasonal crop, bananas are available fresh year-round
I.3.3-Uses of Banana and its products
- Bananas are a staple starchtropical
- The banana plant has long been a source of fibertextiles. In Japan, banana cultivation for clothing and household use dates back to at least the 13th century. In the Japanese system, leaves and shoots are cut from the plant periodically to ensure softness. Harvested shoots are first boiled in lyeyarn-making. These banana shoots produce fibers of varying degrees of softness, yielding yarns and textiles with differing qualities for specific uses. For example, the outermost fibers of the shoots are the coarsest, and are suitable for tablecloths, while the softest innermost fibers are desirable for kimonokamishimo. This traditional Japanese cloth-making process requires many steps, all performed by hand.
- Banana fiber is used in the production of banana paper. Banana paper is used in two different senses: to refer to a paperbark
- There are several types of biomass available from banana plantations and banana processing: wasted fruits, stems, leaves which are widely used as biomass for fuel generation
I.3.4-Banana stem
High concentration of cellulose with low lignin content and its easy availability makes banana pseudostem as potential lignocellulosic biomass which could be used for the production of bioethanol. The composition of BPS on dry basis is holocellulose – 72.71%, klason lignin – 8.88%, acid soluble lignin – 1.9%, ash content – 8.2%, extracts - 3.05% and pectin -0.27% (Chittibabu et al, ).
I.4-RESPONSE SURFACE METHODOLOGY (RSM)
I.4.1-Definition of terms
The Response Surface Methodology (RSM) is a collection of mathematical and statistical techniques useful for the modeling and analysis of problems in which a response of interest is influenced by several variables and the objective is to optimize this response (Montgomery 2005.
The design procedure of the response surface methodology is as follows (S. Raissi, and R- Eslami, 2009):
- (i ) Designing of a series of experiments for adequate and reliable measurement of the response of interest.
- (ii) Developing a mathematical model of the response surface with the best fittings.
- (iii) Representing the direct and interactive effects of process parameters through two and three dimensional plots.
- (iv) Finding the optimal set of experimental parameters that produce a maximum or minimum value of response.
To better understand the sense and logic behind RSM it is necessary to note the significance of the following terms.
I.4.1.1-Factors
They are the causes, assumed or certain, to provoke the process. All factors susceptible to have an influence on the process need to be taken in account, if not results run the risk of being faulty and therefore cannot be exploited. A factor can be qualitative or quantitative, continuous or discontinuous, controllable or not controllable. It could be characterized by one or several natural variables (Mathieu and Phan-tan-luu, 1997)
I.4.1.2-Responses
An experimental response (independent variable) is a measurable manifestation that is observed when factors are varied. A process can eventually be described by many experimental responses and all sorts of response could be envisaged.
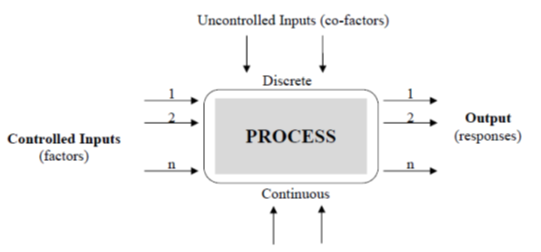
Figure 4 : Relationship between factors and responses
I.4.1.3-Experiment
An experiment (or experimental point) is defined as asset of operating conditions. The factors susceptible to have an influence on the process and whose variations have not been studied are fixed at a constant value throughout the experiment.
I.4.1.4-Matrix of experiments
A matrix of experiments is a mathematical object which represents in a coded or standard form, the set of experiments to carry out. It is a table composed of N-rows, corresponding to N-experiments and of k-columns, corresponding to k-variables studied. The element xij of the matrix corresponds to the level that takes the jth variable at the ith experiment.
I.4.1.5-Experimental domain
The influence of factors (and/or natural variables which characterize it) could be determined by imposing them variations which could cause behavioral modifications of the process studied. To this goal, a domain of variation is defined for each factor (each natural variable too), which could take different levels or values within. “Domain of factors” is known to be the set produced from the set of levels that could each take the factors. The domain of natural variable is defined in the same manner. Each element of these domains represents a set of experimental conditions. The possible experimental domain (or operability domain) is the sub-set of the domain of factors (or natural variables) containing realizable experiments. In practice, this domain is often reduced to the experimental domain of interest.
I.4.1.6-Experimentation surface
An experimental surface is the translation of a matrix of experiments expressed in function of factors (natural variables). It is therefore a table containing data directly exploitable by the experimenter. This table just like the matrix of experiments is composed of N-rows and g-columns. Each of these elements Uij corresponds to the level that can take the jth factor at the ith experiment.
I.4.2-METHODOLOGICAL APPROACH
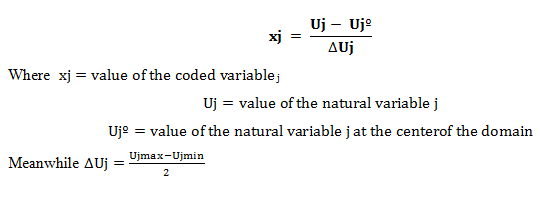
I.4.2.1-Correlation between coded variables and real variables
This operation permits us to compare effects of natural variables which are not necessarily expressed in the same units. The simplest transformation is:
II-MATERIAL AND METHODS
II.1-MATERIALS
II.1.1- Reagents
- Sodium Hydroxide
- Sodium Potassium Tartrate
- 3,5-Dinitrosalicylic Acid (DNS)
- Citric acid monohydrate
- Potassium dichromate
- Sulphuric acid
- Distilled water
- Ammonium sulphate
- Ammonium chloride
- Nitric acid
- Ethanol
- Toluene
- Magnesium sulphate
- Potassium Hydrogen Phosphate
- Glucose
- Calcium chloride
II.1.3-Equipment and Glassware
- Water bath (Memmert)
- Spectrophotometer (Model: Rayleigh)
- Magnetic stirrer
- pH meter (Model: Consort C863)
- centrifuge (Heraeus Biofuge primoR, Kendro laboratory products, Germany)
- Electronic balance
- Soxhlet extractor
- Thermometer
- Beakers
- Pipettes
- Erlenmeyers
- Volumetric flasks
- Measuring cylinders
- Centrifuge bottles
- Crucibles
- Dessicator
- Furnace (Model: Memmert)
II.1.2- Biological Material
- Accelerase 1500: This is a cellulose enzyme complex intended specifically for lignocellulosic biomass processing industries including renewable fuels and chemicals. It is a brown liquid with a working pH range between 4.0 and 5.0. it has an operating temperature range between 50°C and 65°C enzyme was kindly supplied by Genencor USA.
- Banana stem: the banana stem used in this work was of the Musa species. It was gotten from the Efoulan neighbourhood in Yaounde during the rainy season.
- Brewer’s Yeast: Saccharomyces cerevisiae (BRAS 214=28364) was gotten from the GETA laboratory.
- Yeast extract: it was gotten from the microbiology laboratory. It provides nitrogen, vitamins, amino acids and carbon in microbiological and cell culture media.
5. Functional Description
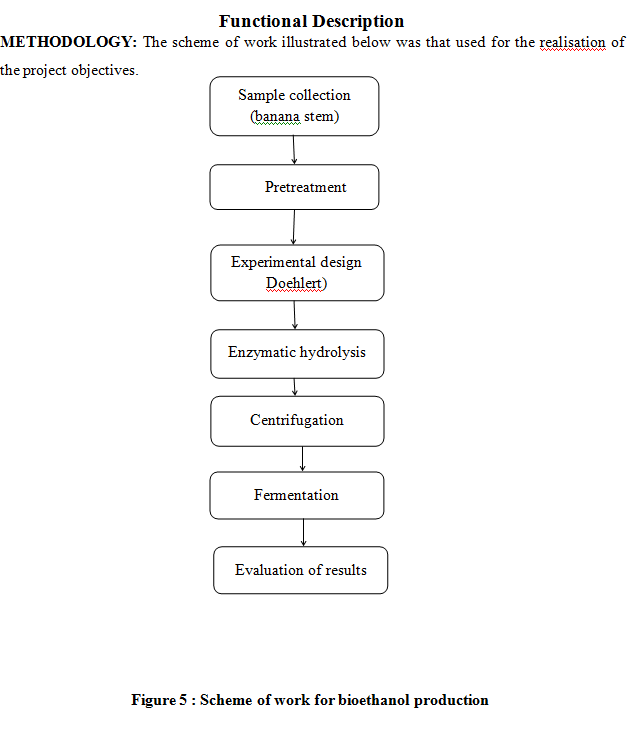
II.2.1- Sample collection and preparation
Banana stems used for the experiment were gotten from the Efoulan neighbourhood in Yaounde. The weight of the original sample was noted, washed and dried in an oven at 105°C for 24 hours to render it moisture free.
II.2.2-Compositional Analysis
- Total solids
This was determined according to the NREL protocol for biomass analysis.
Principle
The total solid in a sample is determined from the loss of weight of the sample upon heating for about 15h.
Procedure
Approximately 1.0 g banana stem was placed in the pre-weighed dry crucible and weighed prior to keeping in a 105 °C convection oven for 15 h. The samples were removed from the convection oven and allowed to cool to room temperature in a desiccator till constant weight was achieved and the total weights of both dish and oven-dried sample were recorded.
Expression of results
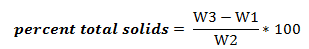
Where W1 = weight of crucible (g);
W2 = weight of the initial banana stem sample (g);
W3 = total weight of sample and sample after 105 °C drying (g).
- Ash Content
Ash content for untreated banana stem was measured based on the procedure provided by NREL.
Principle
Ash is the residue remaining after the water and organic matter have been removed by heating in the presence of oxidizing agents which provides a measure of the total amount of minerals in a sample.
Procedure
Crucibles were placed in a furnace at 575 °C for 24 h and then placed directly in a desiccator to be weighed after cooling to room temperature. Approximately 1.0 g of the banana stem sample was placed into the pre-weighed crucible, weighed, and ashed in the same furnace at 575 °C for 24 hours. The crucible was transferred to the desiccator and allowed to cool before weighing.
Expression of results
The ash content was calculated as:
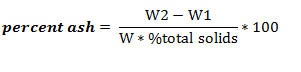
Where W = weight of initial banana stem sample (g);
W1 = weight of crucible (g);
W2 = total weight of crucible and sample after 575 °C ashing (g);
- Extractives
Extractives, which can be removed through a series of extraction procedures, are cell wall chemicals composed of fats, fatty acids, fatty alcohols, and waxes, etc.
Principle
When sample is treated with toluene/ethanol mixture, they pick up the non polar substances in the sample.
Procedure
In this study, extraction was performed for initial banana stem samples based on the analytical procedures described by Han and Rowell (1996). Extraction thimbles were first placed in an oven at 40°C for 24 h, cooled in a desiccator for 1 h and weighed. Approximately 2.0 g of the pre-weighed biomass sample was added to the extraction thimbles which were then placed in the pre-installed Soxhlet extraction units. 300ml of 2:1 toluene: ethanol (v/v) mixture was prepared in a 500 ml round bottom flask along with several boiling chips to avoid bumping. Extraction was carried out in the fume hood for 24 h. After extraction, thimbles were removed from the extraction system and placed in an oven at 40 °C for
24 h, cooled in a desiccator for 1 h and weighed. The sample, considered moisture and extractives free at this point. The extractives were calculated as:
Where W = weight of thimble (g);
W1 = weight of initial banana stem sample (g);
W2 = total weight of thimble and sample after 24 h extraction and subsequent
drying (g);
- Acid insoluble lignin
Acid-insoluble lignin is defined to be the residue, corrected for acid-insoluble ash,
retained on a medium porosity filter crucible after the primary 72% and secondary 4%
H2SO4 hydrolysis steps described in this procedure.
Principle
Biomass is composed largely of cellulose, a polymer of glucose; hemicellulose, a complex polymer of which the main chain consists primarily of xylans or glucomannans; and lignin, a complex phenolic polymer. Unlike the other cell wall components of biomass, the lignin is mostly insoluble in mineral acids. For this reason, lignin can be analyzed gravimetrically after hydrolyzing the cellulose and hemicellulose fractions with sulfuric acid.
Procedure
Acid insoluble lignin (AIL) in initial and pretreated biomass was measured according to the NREL procedure. Approximately 0.5 g moisture-free feedstock was weighed and placed in 100 ml serum bottles. 3ml of 72% sulphuric acid was added to each serum bottle and the acid-soaked biomass was incubated for 1 h in a water bath at 30 °C. The mixture was stirred at the beginning and occasionally during the incubation process to ensure complete contact between acid and biomass particles. Upon completion of incubation, serum bottles were removed from the water bath and acid was diluted by adding 84 ml deionized water to reduce the concentration to 4%. All serum bottles were sealed and autoclaved for 1 h at 121 °C. Samples, allowed to cool to room temperature after autoclaving, were then vacuum filtered through pre-weighed filtering crucibles. Solids remaining in crucibles were rinsed with 40 ml deionized water by vacuum filtration and dried in a convection oven at 105 °C for 15 h. The crucibles were transferred to the desiccator, weighed and placed in the furnace at 575 °C for 24 h. The total weight of crucibles together with the residual ash was measured. Acid insoluble lignin was calculated as:
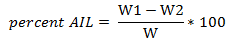
Where W = weight of the moisture free sample determined by multiplying 40 °C oven-dried sample weight (g) by ‘% total solids’
W1 = total weight of crucible and the insoluble residue after drying at 105 °C in the oven (g);
W2 = total weight of crucible and ash after burning at 575 °C in the furnace (g).
- Cellulose content
Principle
Treatment of biomass with concentrated nitric acid and ethanol, the components of the biomass are hydrolysed leaving behind a solid cellulose residue.
Procedure
The determination of the amount of cellulose in the sample was evaluated using the method of Kruschner. 0.9g of ground BS was treated in a solution of 20ml ethanol (95%) and 5ml concentrated. It was then boiled in a water bath at 100 °C for one hour. After filtration, a new treatment is carried out on the same sample under the same conditions. This operation is carried out twice on the same sample.at the end of the third operation, the white paste obtained is washed with distilled water and then dried in an oven. The cellulose content was then calculated as a basis of dry matter.
Expression of results
Cellulose
W1 = weight of sample to be treated
W2 = weight of dried sample after treatment
II.2.3-Pretreatment
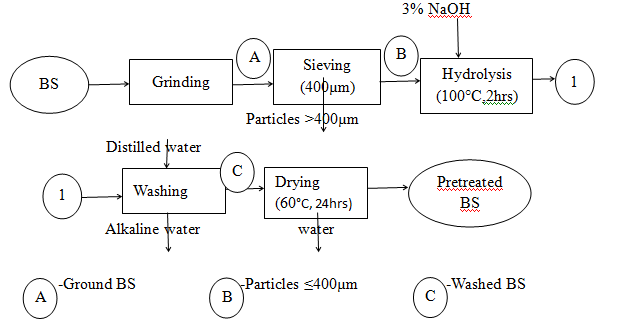
Figure 6 : Process flow diagram for pretreatment
II.2.3.1-Size reduction
The dried banana sample was ground with the aid of a blender and sieve to get a pore size of 400µm.
II.2.3.2-Alkaline pretreatment
The objective of this pretreatment is to get rid of the lignin resulting in improved susceptibility of the remaining polysaccharides to enzyme attack during hydrolysis
Principle
The major effect of alkali pretreatment is the saponification of intermolecular ester bonds which crosslink lignin and carbohydrates, thus increasing porosity and internal surface area of the biomass matrix as well as decreasing the degree of crystallinity of cellulose (Sun and Cheng, 2002).
Procedure
Alkali (sodium hydroxide, NaOH) pre-treatment process was used making the ratio of sample to NaOH to be 1:4. The mixture was incubated for 2 h at 100°C in water bath and washed several times with water to neutralize it. The pre-treated sample was oven-dried at 60°C for 24 h before it could be used.
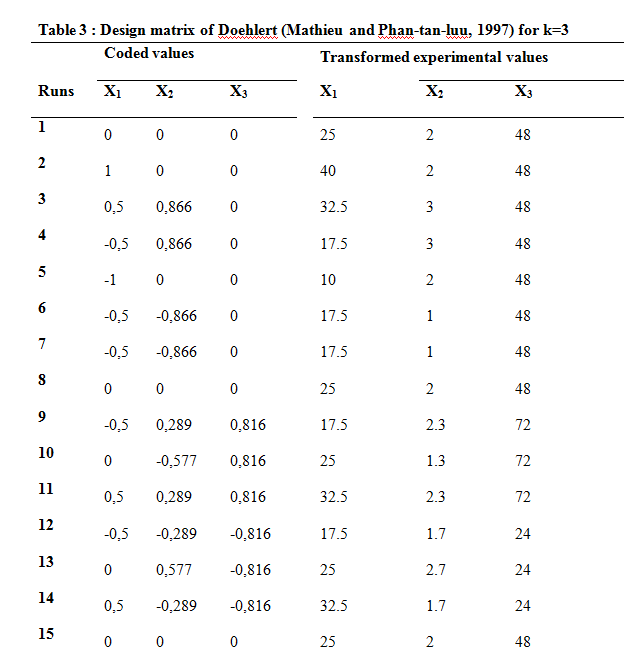
II.2.4-Experimental design
The Doehlert experimental design was used to model three factors. This method is a powerful tool which permits optimization of runs, construction of viable mathematical models, evaluation of factors and optimization of the objective function. It is mathematical and statistically based technic which allows minimization of number of runs obtain the best precision, best possibilities of interpretation and statistical analysis of results (Goupy and Creighton, 2006).
II.2.4.1-Choice of experimental design
The Doehlert experimental design was chosen because it best responds to our needs, taking into consideration time and material constraints. From literature, parameters influencing enzyme hydrolysis include time, temperature, pH, enzyme/substrate concentration, rotation. The aim here was not to exploit all these parameters but to study the nature of our process in the specific case of hydrolysing our substrate. Known optimal values of certain parameters were fixed while exploring the variable factors in the domain of interest. With the Doehlert experimental design, more than two levels can be established per factor. It also permits the introduction of new factors in the course of the experiment hence facilitating progressive acquisition of results. This option is necessary when due to practical constraints, we wish to study first the effect of a few factors, and then subsequently increase the number of factors.
The Doehlert matrix does not possess the same classical properties as response surface matrices. (orthogonality, uniform precision) (Mathieu and Phan-Tan-Luu, 1997).
II.2.3.2-Choice of responses
The response chosen to evaluate hydrolysis is one which best expresses the efficiency of the process. The reducing sugar yield with respect to time was our choice of response.
With the choices made, the real values were determined using the coded values using the following equation.
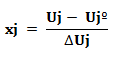
xj=coded value on Doehlert matrix
Uj= real value to be calculated
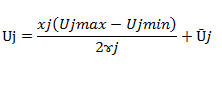
Where ɤj= 0.5 , 0.866 or 0.816
Calculating the real values, we had the matrix presented on the table above. Two supplementary runs were added at the center of the experimental [0; 0] to ameliorate the precision of results and estimate the experimental variance Phan-Tan-Luu (1997).
For all experiments, reducing sugar content was determined as response to the matrix system to obtain an empirical model of second order polynomial given below:
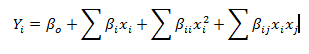
Where; y is the observed response; is the intercept;,,,are linear coefficients; ,, are squared coefficients; ,,,, are interaction coefficients and X1, X2, X3, X12, X22, X32, , X12, X13, X23, are levels of the independent variables. Statgraphics and Sigma plot were used to analyse the data.
- Method
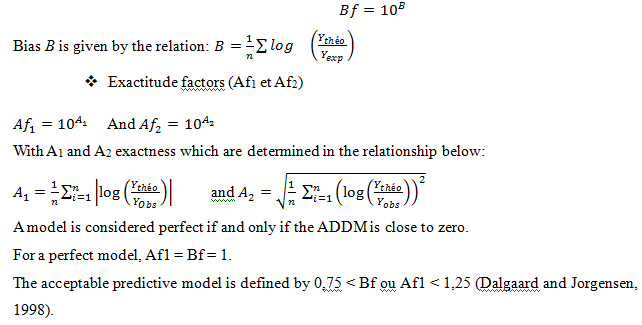
The validity of the mathematical model is confirmed after carrying trial tests of points other than already used in the matrix, belonging to the experimental domain. Another approach is an evaluation of the resultant regression coefficient, R2 by comparing the observed and fitted values. The most appropriate technique is the Absolute Average of Deviation (AAD) which is a direct method to evaluate deviations. It is calculated as follows;
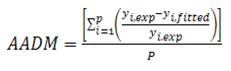
Where, yi,exp and yi,fitted are respectively the experimental and fitted values and P the number of experiments carried out. Evaluation of R2 and AAD values are therefore the most appropriate means of verifying the representativity of the model. Test of adequacy was also performed for this purpose
The response surfaces of the models were realized and Sigma Plot 11.0 version was used to determine the optima.
- Bias factor (Bf)
II.2.5-Enzymatic Hydrolysis
Samples which had previously been pretreated were used for enzymatic hydrolysis. The enzyme Accellerase 1500 was kindly supplied by Genencor, USA. An enzyme assay was performed to determine the activity of the enzyme.
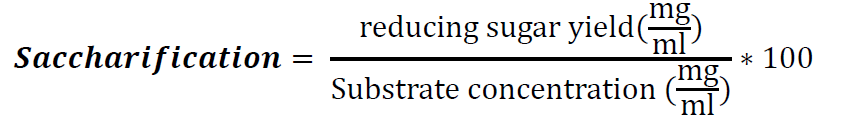
Enzyme hydrolysis was performed using 1-3% of feedstock in 100ml citrate buffer at a pH of 4.5 and a temperature of 50°C. The enzyme was then added at different levels. Enzyme hydrolysis was followed up by measuring the reducing sugar yield between 24-72 hours. The percentage saccharification was calculated using the equation below.
II.2.6-Fermentation
The inoculum was prepared using a media consisting of 50g glucose, 5g yeast extract, 7.5g (NH4)2SO4, 3.5g K2HPO4, 0.75g MgSO4, and 1g CaCl2.2H2O the medium was autoclaved at 121°C and inoculated in a cotton-plugged erlenmeyer flasks and then incubated at 35°C for 48hours. At the end of incubation, the contents of the flasks were aseptically samples were centrifuged at 4 °C and 4000 rpm for 15 minutes the yeast cells harvested were then used for fermentation of the hydrolysate.
2g yeast was used to ferment 100ml of hydrolysate. Fermentation was allowed to run for 72 hours while measuring ethanol production and residual sugars every twelve hours. Quantification
of ethanol was done using the method of Bennet ,
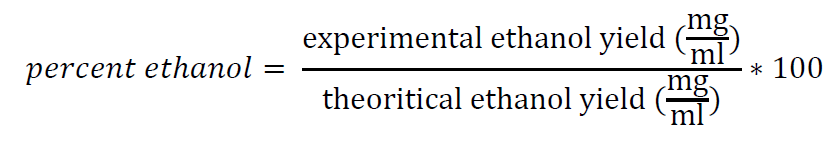
The percentage ethanol yield was calculated as a function of the theoretical yield. 1kg reducing sugars will give 0.511g of ethanol (Caye et al., 2008). Hence using this notion, the theoretical ethanol percentage was deduced and hence used to get the real percentage.
6. Results and Discussion
III.1- Biomass Composition
Banana stem was analysed for its various components. This was to enable us know if banana stem is lignocellulosic. Table 7 presents the biomass composition of our BS.
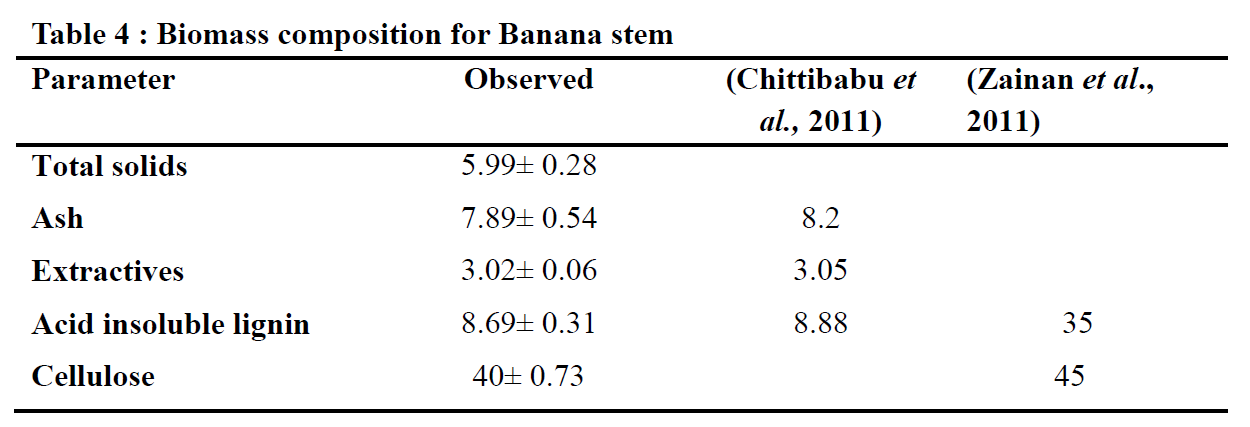
Comparing the results to that obtained by Chittibabu et al., 2011, there was no significant difference in the biomass composition. This shows that geographical location does not affect biomass composition. Comparing with a potential lignocellulosic feedstock like the empty fruit bunch of the oil palm, the lignin content of BS was significantly lower. This implies that it could be easily dealt with as a feedstock for bioethanol production.
For biomass to be considered lignocellulosic, its sum of lignin, hemicellulose and cellulose must be greater than 50% of the total biomass composition. A sum of the corresponding values of the lignocellulosic components determined gives us 48.69%. Hemicellulose content of BS is 28% (Baig et al., 2004) hence adding this to what we determined gives a value greater than 50hence indicating that BS is perfectly a lignocellulosic feedstock. The remaining 23.31% could possibly be acid soluble lignin, proteins and minerals.
III.2-Pretreatment
After pretreatment of BS, its lignin content decreased considerably to 1.26%. This can be explained by the fact that treating the biomass with alkali, a quasi totality of the lignin contained in it was hydrolysed. The major effect of alkali pretreatment is the saponification of intermolecular ester bonds which crosslink lignin and carbohydrates, thus increasing porosity and internal surface area of the biomass matrix as well as decreasing the degree of crystallinity of cellulose (Sun and Chen, 2002). This treatment of BS with NaOH caused visible swelling of `the biomass which subsequently led to decrease in the degree of polymerization, decrease in crystallinity, disruption of the lignin structure, and separation of structural linkages between lignin and carbohydrates (Caye et al., 2008). This thus implies the pretreatment carried out was effective.
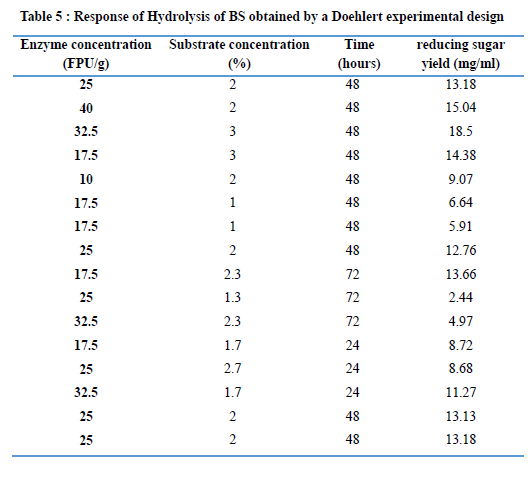
III.3-Enzymatic Hydrolysis
The most challenging part in the production of bioethanol from lignocelluloses materials is the hydrolysis step. In this experiment, fifteen runs were performed using the Doehlert design and the second order polynomial equation that gives the amount of reducing sugar produced as a function of enzyme concentration (X1), substrate concentration (X2) and time (X3). Table 8 shows the experimental reducing sugar produced for each run.
III.3.1-Modeling of the reducing sugar yield response:
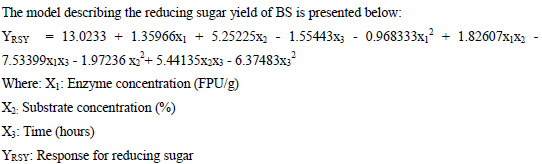
The equation obtained is a second order quadratic polynomial with interactions of three factors. The model shows that the most important factors influencing hydrolysis are those whose absolute values are highest. As such factors can be classified into those that will tend to minimize the reducing sugar yield as well as others that will rather maximize. Amongst such factors, X1 substrate concentration affect significantly the reducing sugar yield and as such, a key element to take into consideration during hydrolysis.
The coefficient of determination indicates an R2 of 88.30%. Absolute Average Deviation of 0.1 coupled to Bf of 0.98 and an Af of 1.1. Also the observed values do not differ much from the predicted responses characterized by residual values. The acceptable predictive model is defined by 0.75 < Bf or Af < 1.25 (Dalgaard and Jorgensen, 1998). This enabled us to validate the model as the AAD was close to zero.
The significance of individual factors to the trend of reducing sugar yield was evaluated by use of the P-value, which presents the analysis of variance. It was observed that, substrate concentration in its linear form influenced the reducing sugar yield (P-Value < 0.05). From this, we can see that one factor is directly involved in the reducing sugar yield. Meanwhile figure 7 presents a graph of direct effects describing the effects of the various factors towards reducing sugar yield.
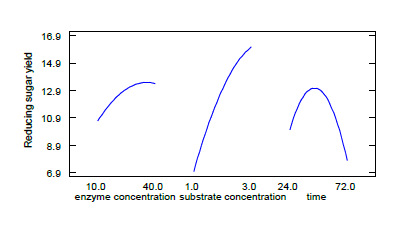
Figure 7 : Graph of Direct effects
A graph of direct effects shows that enzyme concentration as well as substrate concentration affects hydrolysis positively. Nevertheless, substrate concentration affects it more significantly.
Meanwhile the time factor negatively affects hydrolysis.
A three dimensional plot for the interactions help evaluate the possible phenomena occurring during hydrolysis.
The 3D response surface plots for the optimization of hydrolysis process of reducing sugar production are used to investigate the interaction among variables. This plot shows that the best reducing sugar yield is obtained at high substrate concentration and high enzyme concentration.
Hence as substrate concentration increases, likewise enzyme concentration, the reducing sugar yield increases. This could be explained by the fact that as substrate concentration increases, there are more binding sites for the enzyme to act.
A possible explanation for the drop in reducing sugar yield as the time increased could be as a result of the accumulation of cellobiose in the system. Celluloses are broken down to cellobiose by Cellobiohydrolase in the enzyme complex. This cellobiose is then broken down to glucose by beta glucosidase (Chauve, 2011). This decrease in reducing sugar could be due to the fact that the cellobiose was not broken down to its monomeric sugars which are itself an inhibitor to the reaction. Inhibition of Trichoderma cellulase by cellobiose is competitive and increases with resistance of cellulose to breakdown. Hence to improve yields, the hydrolysis step in addition to using a cellulase complex, it should be supplemented with beta glucosidase to prevent accumulation of cellobiose which inhibits the reaction. Moreover this could further be explained
taking into consideration inhibition of the β-glucosidase by glucose. This inhibition is also competitive where there could be formation of an inactive enzyme substrate complex (Marju et
al., 2003).
Furthermore, irreversible adsorptions of cellulases to non-polysaccharides components of the biomass cause lower enzyme activity. Higher activity from the cellulase is more advantageous for higher cellulose degradation to occur. Also, there could be the possibility of lignin still attached to the biomass. Pretreatment gets rid of a quasi-totality of the lignin present in biomass. Lignin binds cellulosic fibers together in a composite structure with excellent properties, but also reduces the accessibility of cellulose to enzymes.
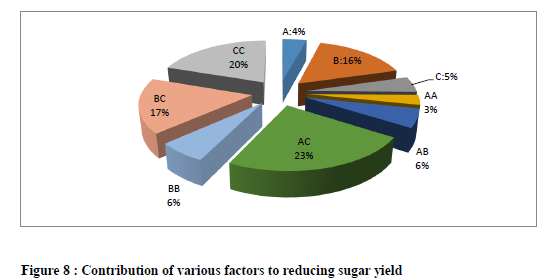
Moreover, this decrease in reducing sugar yield with respect to time could be as a result of decrease reactivity of the substrate. The contribution by absolute value, of each factor to the reducing sugar yield is presented in the pie chart on figure 10.This figure shows that, the quadratic term of enzyme and time had the highest impact (24%) on the reducing sugar yield. It was strongly followed by quadratic form time which contributed 20% and quadratic form of substrate and time. Of these, the linear terms of time, quadratic term of enzyme, enzyme and time, and substrate had a negative impact on the reducing sugar yield.
Following analyses of the results obtained, an experimental run was carried out to verify the optimal points. Table 9 presents parameters for optimal response.
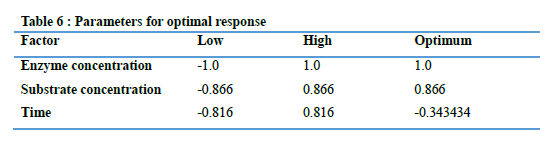
A combination of these factors at their different levels gave an optimal response of 18.81mg/ml.
An optimal response of 18.37 mg/ml was gotten which was quite close to the theoretical values obtained. Baig et al., 2004, obtained reducing sugar yield of 1.34 mg/ml after saccharification of banana agrowaste. This value was quite low comparing to what was obtained.
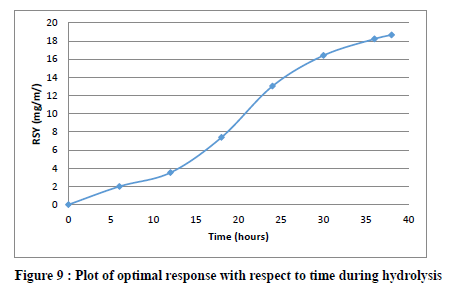
A graph of optimal response with respect to time gives a typical Michaelis Menten‟s plot which shows a reducing sugar yield increases as time increases and becomes practically constant after a certain time interval due to saturation of active site by substrate. At this point, a saccharification percentage of 71.8% was obtained.
From the results, it can deduce that the substrate was not completely hydrolysed. This could be as a result of the lignin present in it. The pretreatment carried out on the BS was that using NaOH. Pretreatment using NaOH removes a quasi-totality .This could be ameliorated by carrying out a pretreatment which could possibly get rid of all the lignin for instance using lignin hydrolysing enzymes.
III.5-Fermentation
Following fermentation, the alcohol obtained was quantified by spectrophotometry, likewise the residual sugars and the evolution of microorganisms in the fermentation broth.
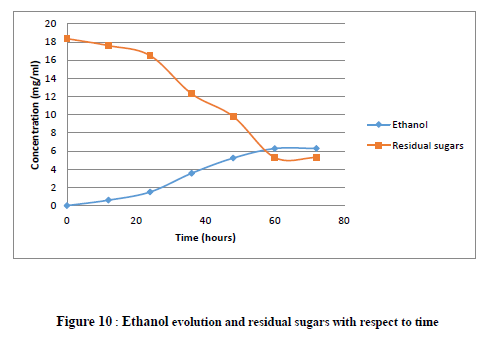
From the figure above, it is clear that as time increased, the ethanol concentration in solution increased becaused they were being fermented by the microorganisms. Initially, the ethanol concentration was quite low. This can be explained by the fact that the yeasts were still trying to adapt to their new environment and after 24 hours production increased steadily as they were in an active metabolic period. As from the 60th hour, the ethanol concentration was almost constant. This can be explained by the fact that the yeast cells were probably inhibited at high ethanol concentrations. Hence at this point, they could no longer use up the remaining sugars in solution for fermentation. This problem of inhibition could be resolved by using ethanol tolerant yeasts. At the end of the fermentation process, an ethanol concentration of 6.29 mg/ml was obtained.
Considering that the initial sugars used for fermentation were all fermented, then we should have an ethanol concentration of 9.38 mg/ml (theoritical yield). but this was not the case because the microorganisms most probably used up some of the sugars for growth. The ethanol yield gave us 67.0% of theoritical yields. Furthermore, the residual sugars in the fermentation broth were quantified to verify fermentability of the sugars by the yeasts.
At the beginning of the fermentation process, the sugar concentration was at 18.37mg/ml, which decreases progressively with time as it is being broken down by yeasts in solutions to alcohol.
After the 60th hour, the concentration was almost constant as the ethanol produced tends to inhibit yeast growth. Consequently, residual sugars in the fermentation broth could not be used.
Furthermore, the presence of residual sugars in the fermentation broth indicates that there are possibly some sugars in solutions which cannot be fermented by Saccharomyces. For instance the presence of cellobiose and other reducing sugars like xylose which cannot be fermented by Saccharomyces. This could be improved upon by using the recently developed DA24-16 strain of Saccharomyces cerevisiae which incorporates a xylose assimilation pathway and a cellodextrin transporter that permits rapid growth on xylose and cellobiose (Fox et al., 2012)
7. Conclusion
This study was aimed at introducing an enzymatic process for the production of bioethanol from lignocellulosic biomass using banana stem as our case study.
At the end of this work, optimal conditions for hydrolysis of banana stem was fixed at 40 FPU/g for enzyme concentration, 3% for substrate concentration and 38 hour as hydrolysis time.
Optimal production gave a reducing sugar yield of 18.37 mg/ml and a saccharification percentage of 71.8%. Following saccharification, an ethanol yield of 67.0% of theoretical yields was obtained. A block diagram for future work was finally established.
The Doehlert experimental design used to model the parameters seemed not to perfectly model and optimise the hydrolysis step.
- This could be amended by increasing the number of parameters for instance rotation speed.
- Furthermore, reducing sugar yield could be ameliorated by supplementing the enzyme mix with β-glucosidase to prevent feedback inhibition.
- Moreover, this process could be ameliorated by modelling the pretreatment step as well as the fermentation step.
- Likewise, a more ethanol resistant yeast species should be used for fermentation so as to ensure maximum use of sugars.
- The scope of work should be expanded, not just banana stems but also leaves, peelings and valorisation of different lignocellulosic waste like waste office paper.
- This laboratory work be validated and/or improved at a pilot scale so that this could be carried out at an industrial level.
