From Friday, April 19th (11:00 PM CDT) through Saturday, April 20th (2:00 PM CDT), 2024, ni.com will undergo system upgrades that may result in temporary service interruption.
We appreciate your patience as we improve our online experience.
From Friday, April 19th (11:00 PM CDT) through Saturday, April 20th (2:00 PM CDT), 2024, ni.com will undergo system upgrades that may result in temporary service interruption.
We appreciate your patience as we improve our online experience.
University: Yanbu Industrial College (Saudi Arabia)
Team Members (with year of graduation): (1) Ahmed Adi Raghep Altaluoni, (2) Yasser Eid Lapss Al Shreaf, (3) Awad Al Rashidi,
Faculty Advisers: Engr. Muhammad Javed Iqbal
Email Address: miqbal@yic.edu.sa / mjavediqbal99@yahoo.com
Submission Language : English
Title: Pollution Monitoring & Weather Station
Description:
Introduction
Weather monitoring has very high impact on modern era; it has given thousand years agriculture a new dimension and made it more efficient and productive, modern day aircrafts cannot takeoff or land without having weather information. On other hand pollution can significantly affect quality of our life and endanger human with chorionic diseases which increase mortality in the region. We are based in Yanbu Industrial City, Saudi Arabia, which is one the largest industrial city of the country. There are hundreds of petrochemical industries and oil refineries located in this city and hence produces lot of air and water pollution which severely affecting the weather and environmental conditions of the city and the surroundings.
By developing Weather station and pollution monitoring system we can offer community service to the residents of Yanbu city by providing them weather and pollution updates and alerts. Our system collects information from different sensors through NI Wireless sensor network, analyzes this data send information to local community through LabVIEW web application, NI data dashboard for mobile devices and SMS.
Some of the benefits for local community are listed below;
1. Our system can send high air pollution alerts to residents to wear masks and turn their ac to room circulation to protect them.
2. Our system can guide farmers to plan their irrigation schedule.
3. By weather forecasting, our system can help the residents to plan their outdoor activities or travelling.
4. By careful weather data analyzing, suitable locations or seasons could be identified for wind turbines and solar panels.
5. Researchers/teachers can utilize the acquired weather or pollution data in their advance research or to develop better understanding in this field among the students.
6. It can provide information to civil contractor to plan their work timeline by predicting weather.
7. It can send bad weather alerts to fishermen to plan their fishing activities.
Products used in this project:
NI Products:
Selected as best product in 2010 and got Engineer choise award , it act as data gateway for weather and pullotion data
Selected as best product in 2010 and got Engineer choise award , user firendly labview programble node,it act as wireless node for weather and pullotion sensors which have analog outputs.
Selected as best product in 2010 and got Engineer choise award , user firendly labview programble node, It act as wireless node for temperature and digital sensor.
Very easy to use graphical programming language for the engineers scientist and researcher , we can quickly turn ideas into reality using this language all programming of this project is done in this language.
By using LabVIEW Web Server and Web publishing tool any one can remotely access weather and pollution VI through internet with LabVIEW run time engine. If the user is not having LabVIEW run time
engine and he/she is having restricted and secured even though the LabVIEW support is there and using LabVIEW web services the user the can connect and access the weather and pollution data as a thin
client in standard HTTP interface.
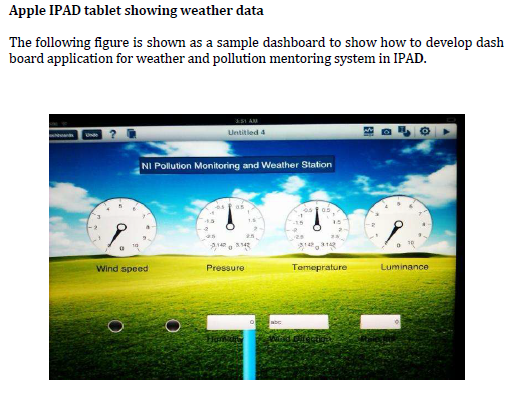
By using Data Dashboard for LabVIEW , We make portable view of Weather and pollution application on tablet and smart phone. The app displays the values of network-published shared variables and/or Web services on charts, gauges, text indicators, and LEDs.
By using NI WSN Wireless tool kit for LabVIEW we program WSN nodes, this toolkit give benefit rapid development of graphical programming for your entire application.
This kit used for web cam interface on to monitor weather condition from indoor window, this can also be used to detect cloud on the sky in the future.
Other Products:
Challenges:
We have faced many challenges during the development cycle of this project, some of major challenges are as under;
1. The biggest challenge was to develop a cost effective, highly efficient, innovative and portable pollution and weather monitoring system. This system should be able to serve the community for weather updates
and safety warning. Also the system should support the various authorities to improve the living conditions in the city. The portability was required to use this system at remote locations or in the harsh
environment. The system data and results should be accessible easily through internet and other wireless services for the community.
2. Weather Prediction is considered as one of most challenging field in the world and we took up this challenge.
3. Determining wind and solar efficiency under the difficult weather conditions of Saudi Arabia, to save fossil fuel export the fuel to get more revenues.
4. Utilizing weather data for regulation greenhouse parameters for suitable condition.
5. Localized use of sensor nodes monitoring pollutant gases and bin level in residential garbage container and generate visual alarm.
6. Make this system portable and cost effective. As students we were looking for highly cost effective but accurate and highly efficient solution for our project. The portability was also required to use this system at
remote locations or in the harsh environment.
Solutions to the Challenges:
1. To develop our Pollution Monitoring and Weather Station, We decided to use NI products and LabVIEW platform. After exploring all the latest technologies we found that for the rapid development of any robust,
efficient, accurate and cost effective data acquisition, measurement and control system application nothing is better than LabVIEW in the world. Thus we selected LabVIEW 2012 with its ready to use tools for
developing our software application. On hardware side, we found a wide range of sensors are required to measure weather and pollution data. Some of the sensors are digital, some are analog, their operating
conditions and characteristics were also varying. To acquire data from these sensors we were looking for a product which can be interfaced with digital or analog sensors easily. We found that NI Wireless
Sensor Network (WSN) kit is the most appropriate solution to interface and acquire the data from these sensors. The WSN kit can easily be configured; it can be connected easily with variety of sensors through
its digital and analog ports; it is highly portable; on the other side the WSN kit can also communicate easily with LABVIEW. So we selected NI WSN kit for interfacing with sensors and actuators with LabVIEW
application in our project.
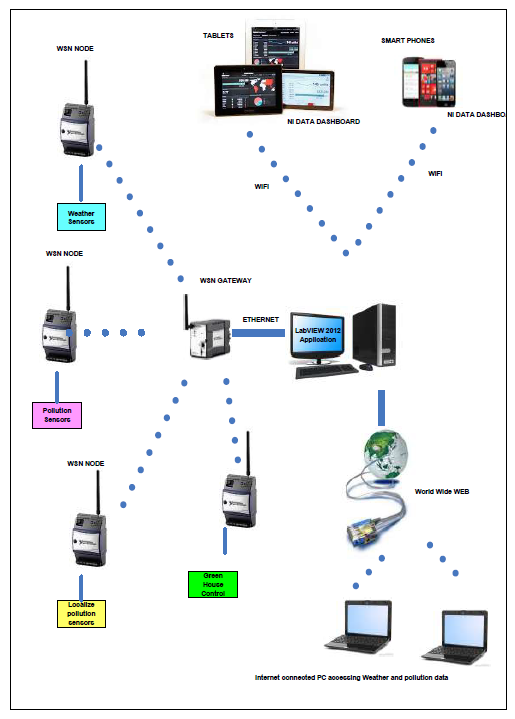
In our system the WSN nodes acquires the data from sensors and transmits it to the WSN gateway which is connected with host PC. The LabVIEW application running in the host PC receives the data from
WSN gateway through network cable The data is analyzed through easy to use LabVIEW tools and displayed on the front panel numerically and graphically. Using NI web server and web services the data and
appropriate warnings are published on the internet and Local Area Network. Any user from anywhere in the world at any time can access the data and results through internet. Using NI Data Dashboard the users
can also access the data through their smart phones and tablet PCs . Last but not least SMS engine can also be easily connected to LabVIEW, which provides all necessary VI to send SMS to users.
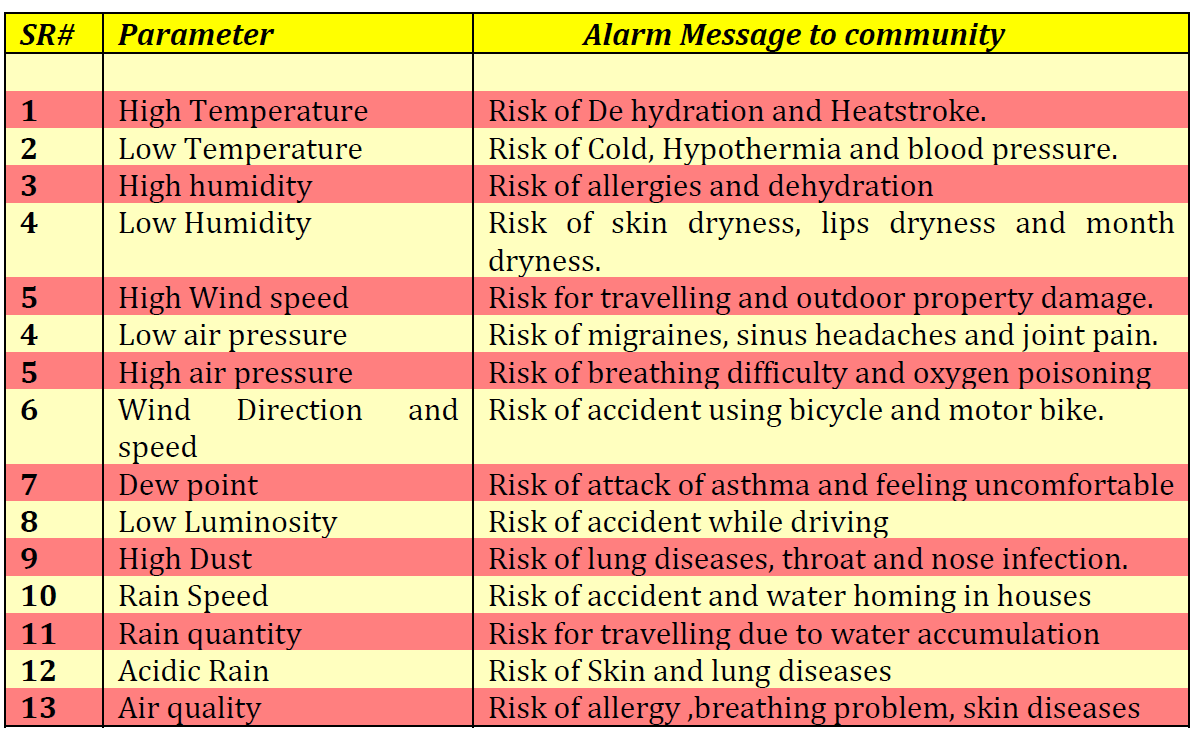
Following Second thing we have done is research how weather and pollution disturb the human life table below shows risk of alerts
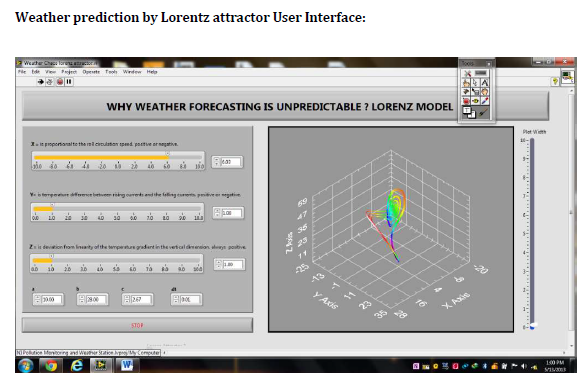
2. For weather prediction algorithm we have used LORENZ attractor. This method requires solving differential equitions with weather data values and then plotting the results in 3D graph. We have used LabVIEW
flexible and easy to use tools to solve complex differential equation and then plot the results in 3D curve graph and 2D graph. By analyzing the results in the graphs, weather forecasting is possible.
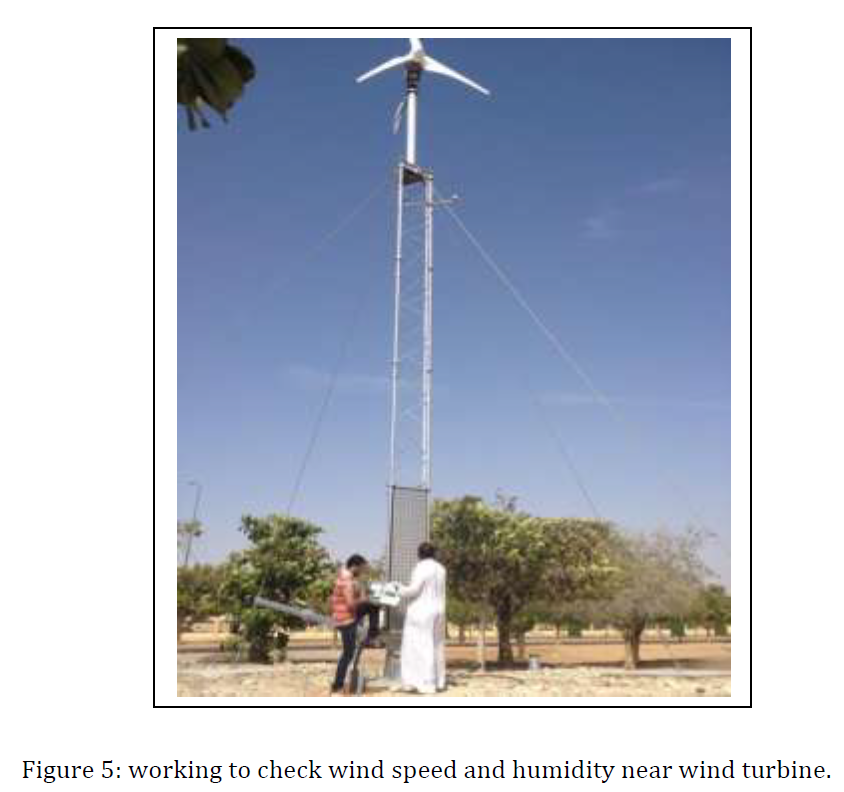
3. By deploying the sensors at various solar panels and wind turbines through WSN nodes. The data is collected to investigate the effects of temperature, humidity, pressure and wind density and other weather
conditions on the efficiency of Solar panels and wind turbines.
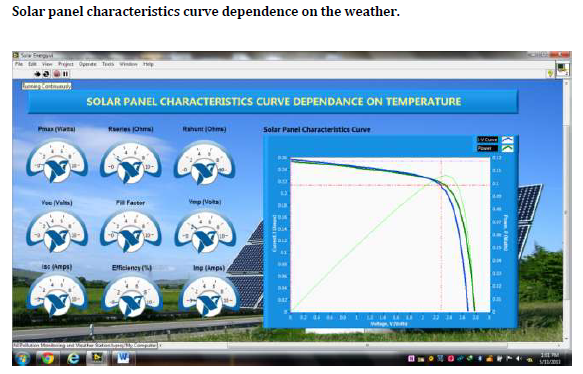
One of the result for this research is shown in Figure 1,which shows the effect of temperature on the efficiency of solar panel.
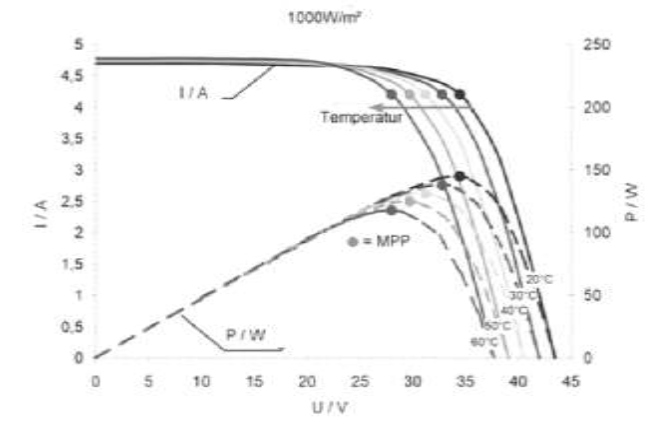
Figure 1: The experimental results of solar panel power current voltage at different temperature.
Figure 1 shows as the temperature increase the power generated by solar panel decrease due to decrease in the voltage but current of the panel remain same. In our experimental setup WSN-3212 node monitor the outdoor temperature and send data to NI-9791 gateway by which we calculated the efficiency of the solar panel. Similarly we found out that efficiency of solar panel also decrease by dust sensor.
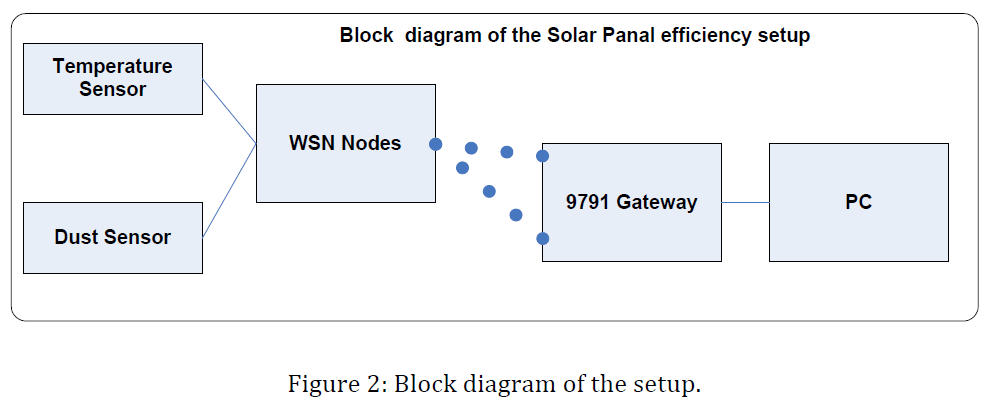
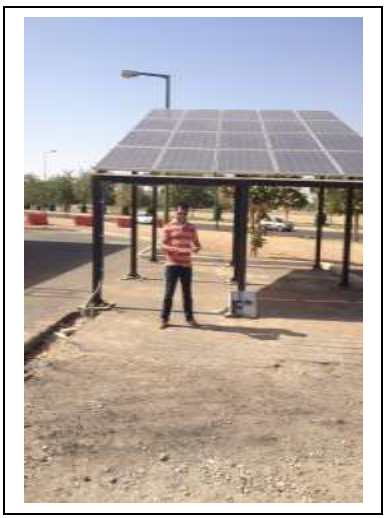
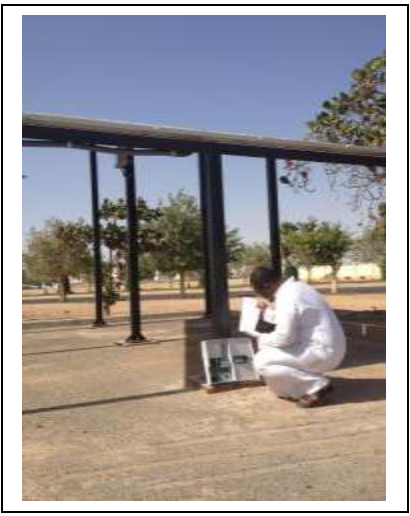
Figure 3: working to check the temperature and dust near solar panel.
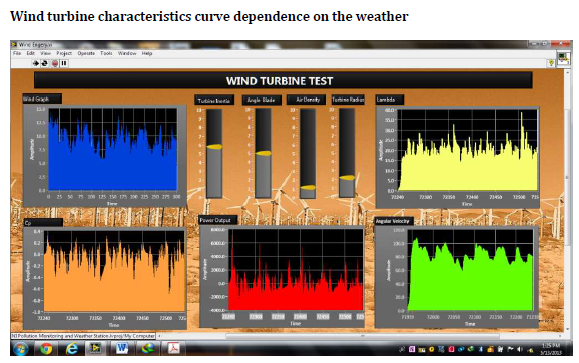
Experimental setup of determination wind power and weather consist of WSN-node 3202 and NI-9791 block diagram of setup is shown below,
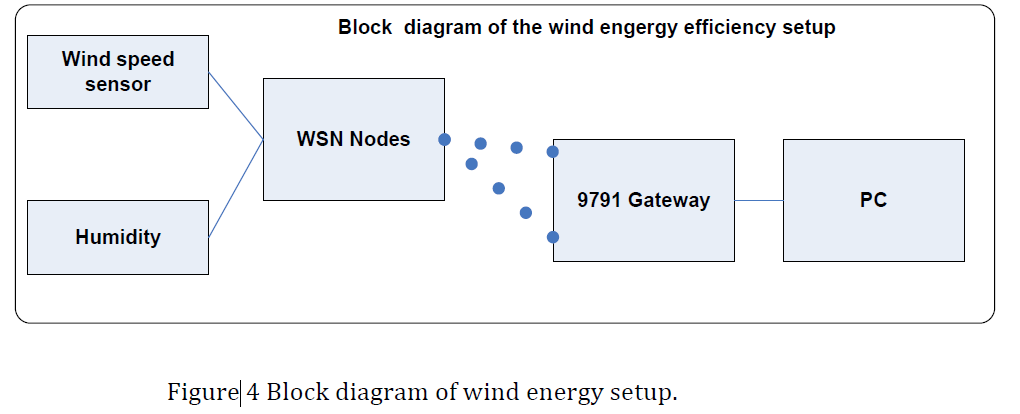
From the experiment we concluded that,
• The amount of energy which the wind transfers to the rotor depends on the density of the air, the rotor area, and the wind speed.
• The kinetic energy of a moving body is proportional to its mass. The kinetic energy in the wind thus depends on the density of the air, i.e. its mass per unit of volume.
In other words, the "heavier" the air, the more energy is received by the turbine; at 15° Celsius air weighs about 1.225 kg per cubic meter, but the density decreases slightly with increasing humidity.
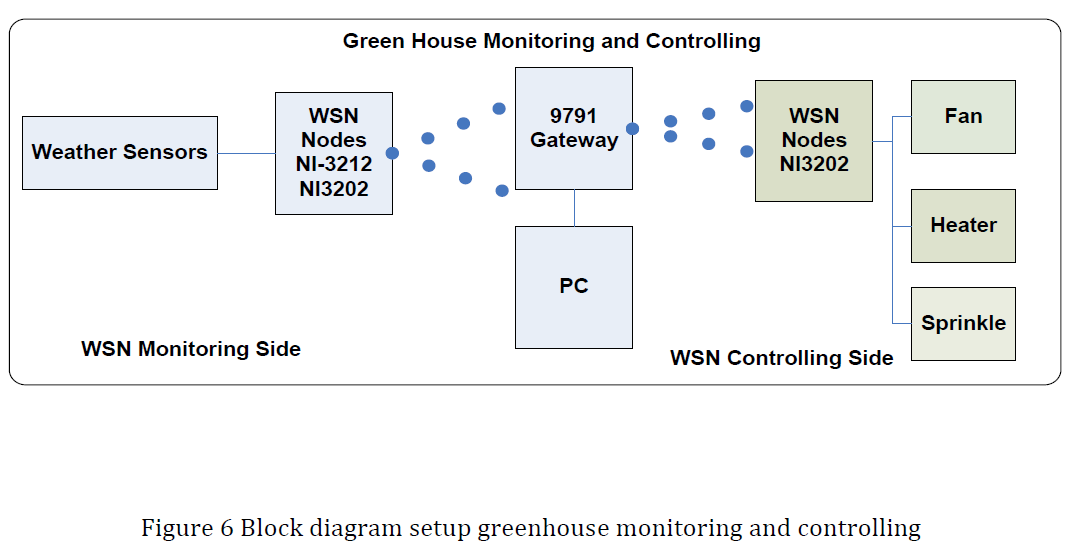
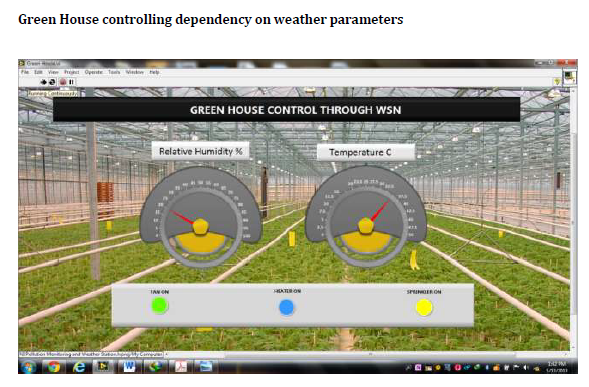
4. By using weather sensor data from WSN nodes we can control fan, sprinkle and heater for green house, NI-WSN 3202 has digital output pins are used make simple ON-OFF controller for controlling greenhouse
parameters.
Block diagram representation of the solution is shown as under,
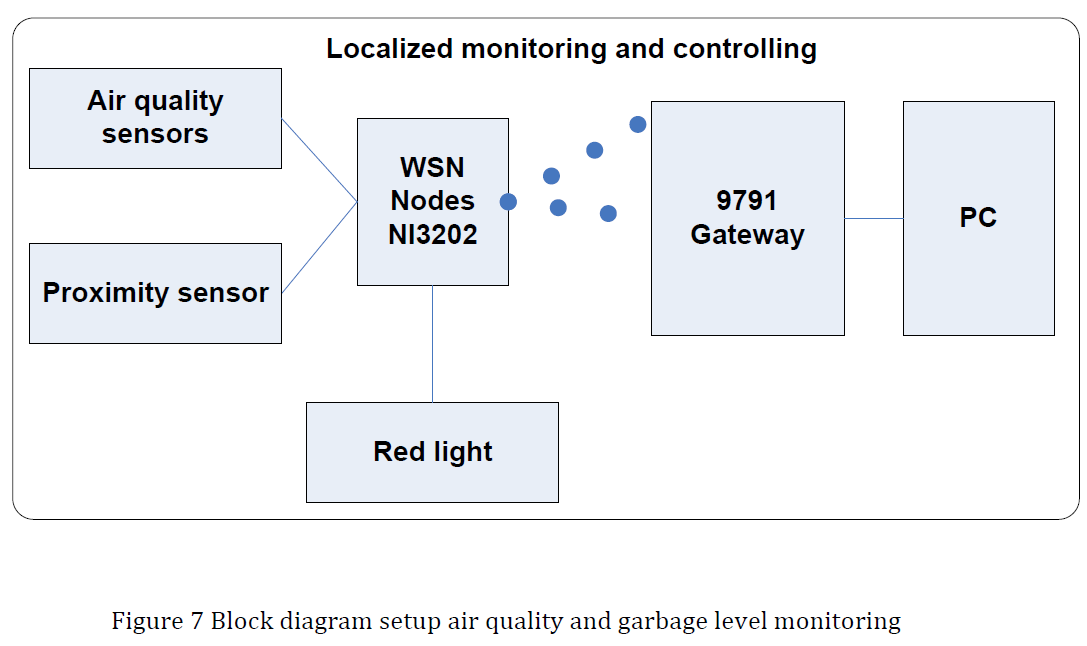
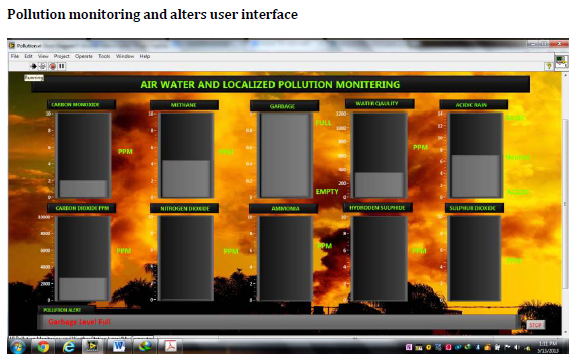
5. By using WSN-3202 node with air quality sensor we have protected community from bad and dangerous smell coming from garbage container. We have connected one proximity sensor with WSN-3202 which
monitors how much garbage container is full. When node get bad smell signal or garbage container is full it turn on red light.
Block diagram implementation of localized pollution monitoring system is shown in the figure bellow,
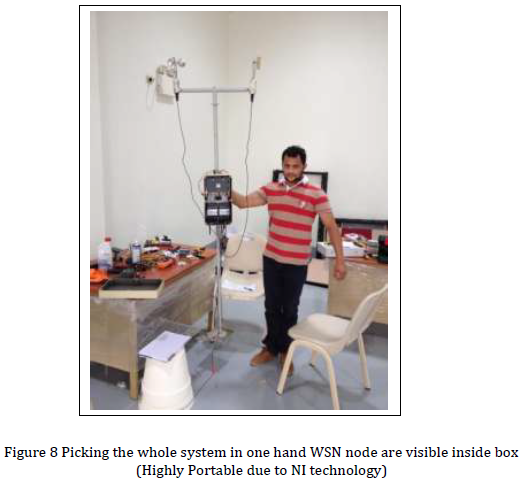
6. We have used light weight pipe and environmental protected box mounting sensors and WSN nodes which protect our system from any hazardous condition. For Powering up our station we +12V portable
battery which is mounted inside the box. One of the benefits of WSN-Nodes is that they consume very less current, so don’t need to replace battery for years.
Complete System Block diagrams:
Hardware implementation of the System:
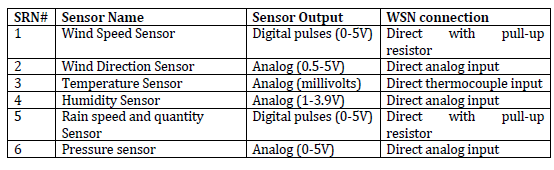
We are using both analog and digital sensors in our project because the nodes provide us flexibility to connect both types of sensors with our system without needing signal conditioning circuit.
Following table describe sensor and its output and connection to WSN.
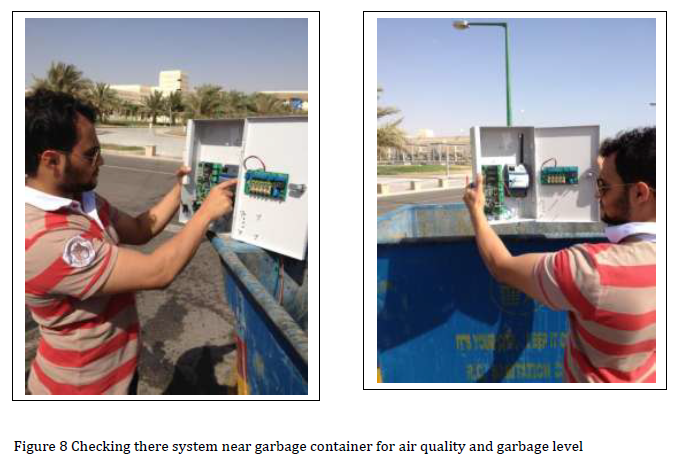
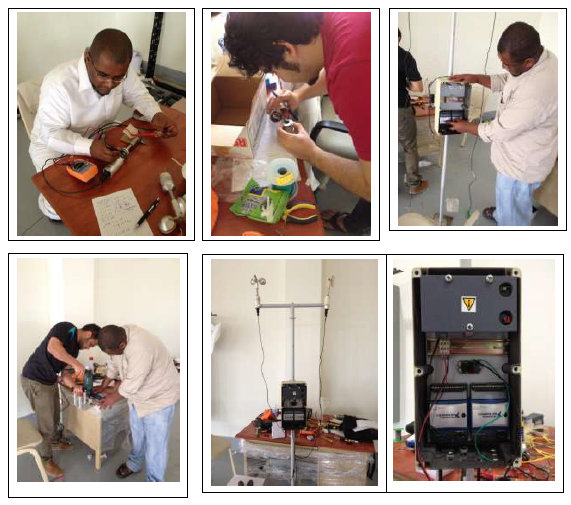
Following are the few pictures shows hardware implementation of our project,
Software implementation of the System:
Software implementation of this system consists of following modules.
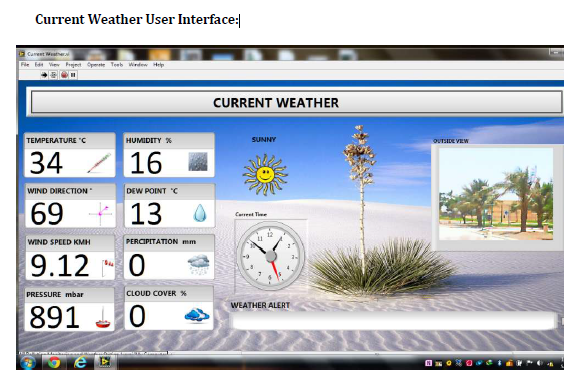
1) Current Weather User Interface
2) Weather Statistics and Recording Interface
3) Weather prediction by Lorentz attractor
4) Solar panel characteristics curve dependence on the weather
5) Wind turbine characteristics curve dependence on the weather
6) Pollution monitoring and alters user interface
7) Green House controlling dependency on weather parameters
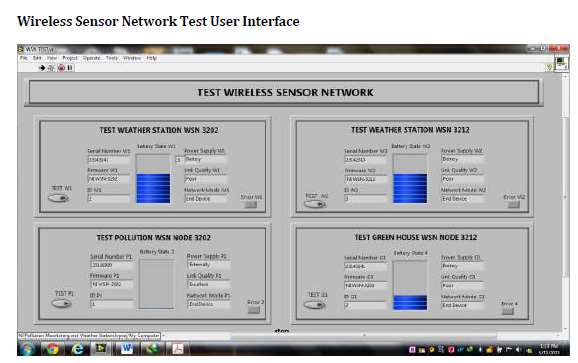
😎 Wireless Sensor Network Test User Interface
9) Software for Tablet PC and Smart phones NI-Data Dash Board
Front Panel of Main VI
We have used customize LabVIEW control to make front panel interface beautiful.

Acknowledgement:
We are highly thankful to Dr. Nabil Rouson, HoD EIET Department, Dr. Abdulmonem Alzalabani, D.M.D, Yanbu Industrial College, Dr. Gasim Alandjani, M.D, Yanbu Industrial College and Dr. Ahmed M. Dabroom D.G., RC Colleges and Institutes Division at Yanbu for their enormous support.
