- Document History
- Subscribe to RSS Feed
- Mark as New
- Mark as Read
- Bookmark
- Subscribe
- Printer Friendly Page
- Report to a Moderator
- Subscribe to RSS Feed
- Mark as New
- Mark as Read
- Bookmark
- Subscribe
- Printer Friendly Page
- Report to a Moderator
NI myDAQ is capable of streaming live audio signals into and out of your computer. The advantages myDAQ provides over a low-cost sound card include more reliable driver support, complete control of sampling rates, and a known high quality signal path.
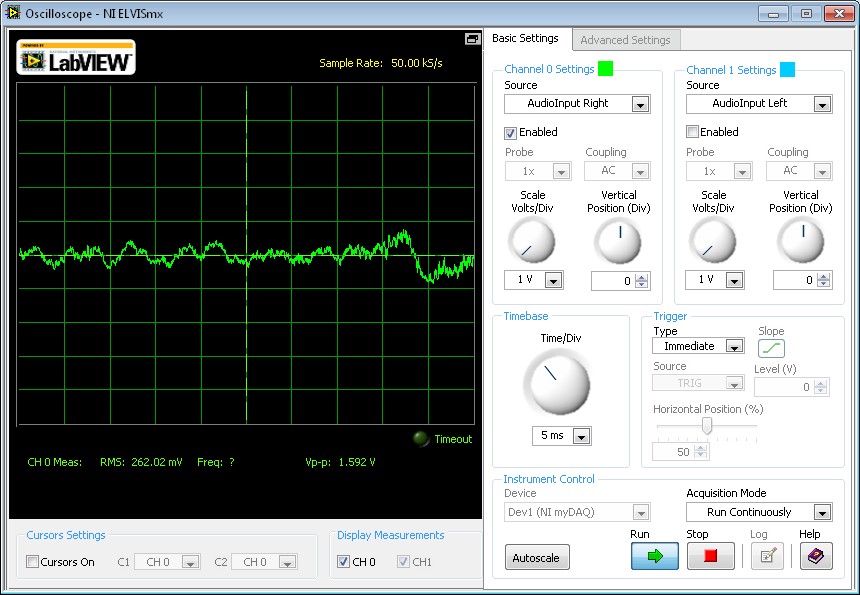
Your First Audio Experiment: Acquire Audio Using the myDAQ Oscilloscope
- Open the Oscilloscope from the NI ELVISmx instrument launcher
- Change the Channel 0 Source to AudioInput Right
- Press the green Run arrow
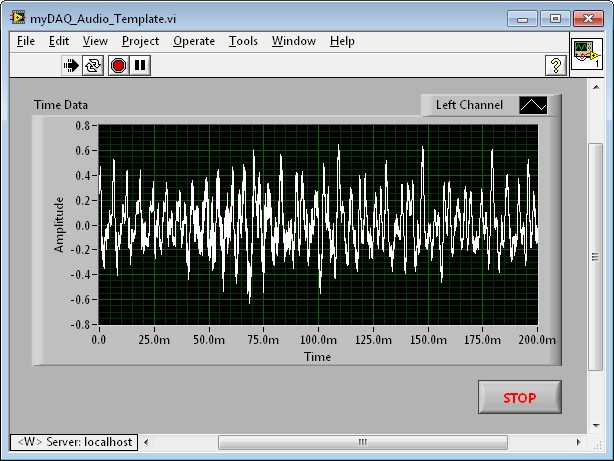
Your First LabVIEW Based Audio Experiment: Acquire and Graph Audio Signals
- Download the attached file VI myDAQ_Audio_Template.vi and open it in LabVIEW.
- (If your myDAQ is not Dev1, Change it to Dev1 in Measurement & Automation Explorer)
- Attach a music source to the AUDIO IN port of your myDAQ
- Attach a pair of PC speakers to the AUDIO OUT port of your myDAQ
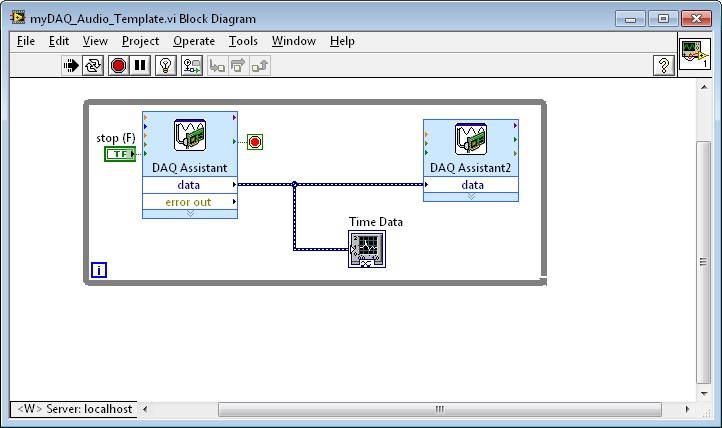
This VI consists of a DAQ Assistant read operation from the Analog to Digital Converter (ADC) that passes data to both the Time Data graph and the DAQ Assistant2 that performs the write out through the Digital to Analog Converter (DAC). The functions appear in a while loop whose stop condition is wired to the DAQ Assistant 'stopped' terminal. This condition changes from false to true when the stop(F) button is pressed.
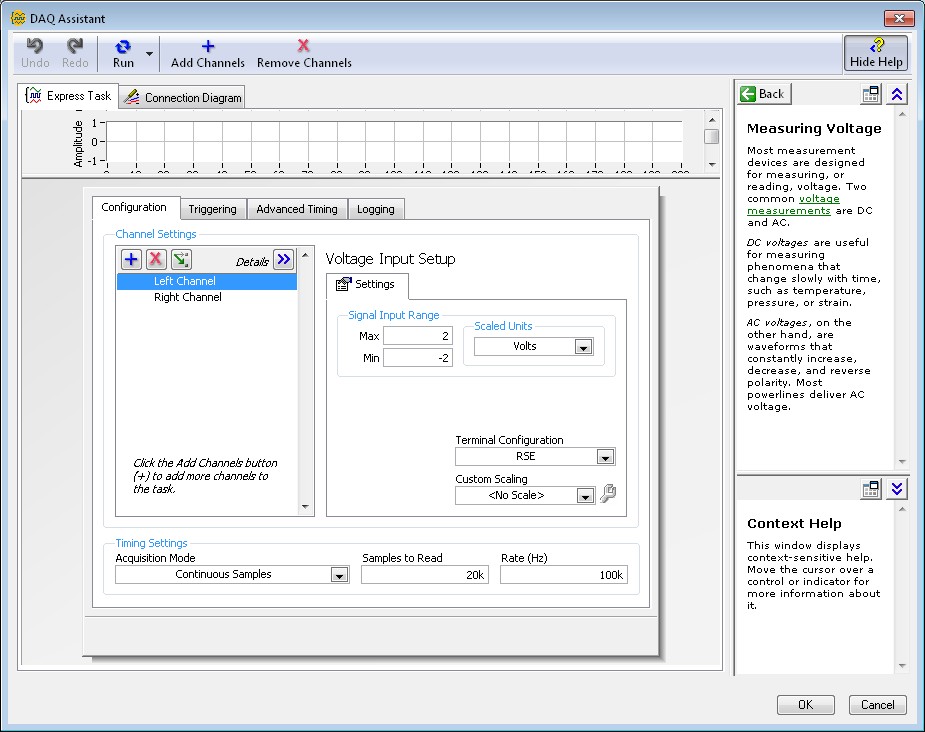
Understanding the DAQ Assistant Configuration for Audio Write Operations
The Left and Right Channels of audio are each configured as follows:
- Max: 2 Volts
- Min: -2 Volts
- Acquisition Mode: Continuous Samples
- Samples to Read: 20k (20,000)
- Rate (Hz): 100k (100,000)
(Hint: The DAQ Assistant Read requires very little configuration because it will pull both Rate and Samples to Write from the dynamic or waveform datatype wired to it.)
Sampling Parameters
The following terminology will aid you as you learn the functionality of an ADC. The following content discusses the relationships between Rate, Samples to Read, and the frequency of an analog signal.
Rate (Hz): Indicates the sampling rate of the analog to digital converter. Recall that the typical human ear can perceive audio frequencies from about 20 Hz to 20,000 Hz. Nyquist’s rule states that in order to properly reconstruct the audio spectrum you must sample greater than 2 times the maximum signal frequency, in this case greater than 40,000 Hz. The units of the Rate value is samples/second/channel.
Using the step one above, 100k indicated 100,000 samples per second per channel or 1 sample every (1/100,000 seconds) or once every 10 micro seconds.
Samples to Read: Indicates the number of samples to read each time the VI runs. In this case the DAQ Assistant read will return 20k or 20,000 data points each time the VI is executed. This also means that the graph will display 20,000 points. The units for Samples to Read is samples. You can also calculate the amount of time represented by each buffer by dividing the Samples to Read by Rate. In the case above each buffer represents 1/5 of a second/channel or 0.2 seconds/channel.
Hints:
- If the sampling Rate becomes to slow, the audio quality will be affected.
- The max sampling Rate of myDAQ is 200ks/s
- If Samples to Read is too low, the VI will not be able to keep time and will show an error
- If Samples to Read is made large, the VI will take seconds to respond, even after the stop button is pressed
Explore the parameters by trying the following rates and commenting on the following questions:
Rate (Hz) | Samples to Read | Graph Points | Sound Quality | VI Errors |
100k | 20k | |||
10k | 5k | |||
10k | 1k | |||
100k | 100k |
