- Subscribe to RSS Feed
- Mark Topic as New
- Mark Topic as Read
- Float this Topic for Current User
- Bookmark
- Subscribe
- Mute
- Printer Friendly Page
RT Trace Viewer produces 'unbelievable'(?) logs
02-03-2020 01:00 AM
- Mark as New
- Bookmark
- Subscribe
- Mute
- Subscribe to RSS Feed
- Permalink
- Report to a Moderator
Hi all,
Since probably the RT Tracing tools work fine, I guess I'm doing something wrong... But the results I see are somewhat strange.
Could someone highlight what's going on, and how I could get a better idea of what's going on with my application?
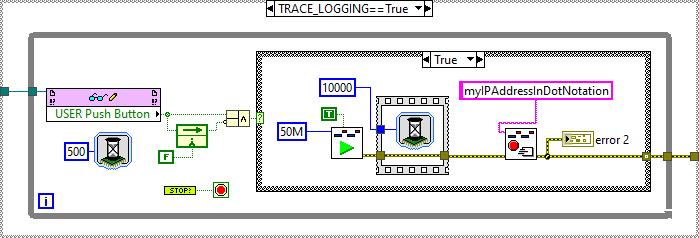
I've set up the cRIO (9045) to log 10 seconds of activity using the Start and Stop+Send Trace VIs every time the User button is pressed.
This appears to work - it takes quite a bit longer than 10 seconds, but I think this might be some processing of the log after Stop+Send is called - viewing resource usage using e.g. MAX or log files of the CPU usage show one core at 100% after each time I press the button for about the amount of time between expecting results and receiving results in the Viewer.
Is it possible to do this and trust the results, or have I fallen down at step 1 here? (I note the help says you can't resize the buffer, but it doesn't say if you can reuse the same buffer repeatedly to log more than once)

Incidentally, is 50M bytes about what you'd expect for 10 seconds of log? (It doesn't require this much, but setting a lower amount, say 25M, means the trace I receive is shorter than 10s. 50M seems fine, although memory usage on the host PC goes up by 1GB when receiving the trace...)
My application is calling one preallocated reentrant VI containing a loop that uses an object to acquire data.
Every 0.2 seconds (for the first type of acquisition - others have different periods, but this will do as an example) "Acquisition Main.vi" is called, which is preallocated, static dispatch.

Here you can see that the object has a flag number (this is a dynamic dispatch VI, shared clone), and that number is between 0..3 inclusive.
Before the "Acquisition Main Core.vi" is called (dynamic dispatch, specific to the acquisition type) a trace event is created with that number.
After the Acq Main Core returns, another event (with the same number + 4) is flagged/logged.
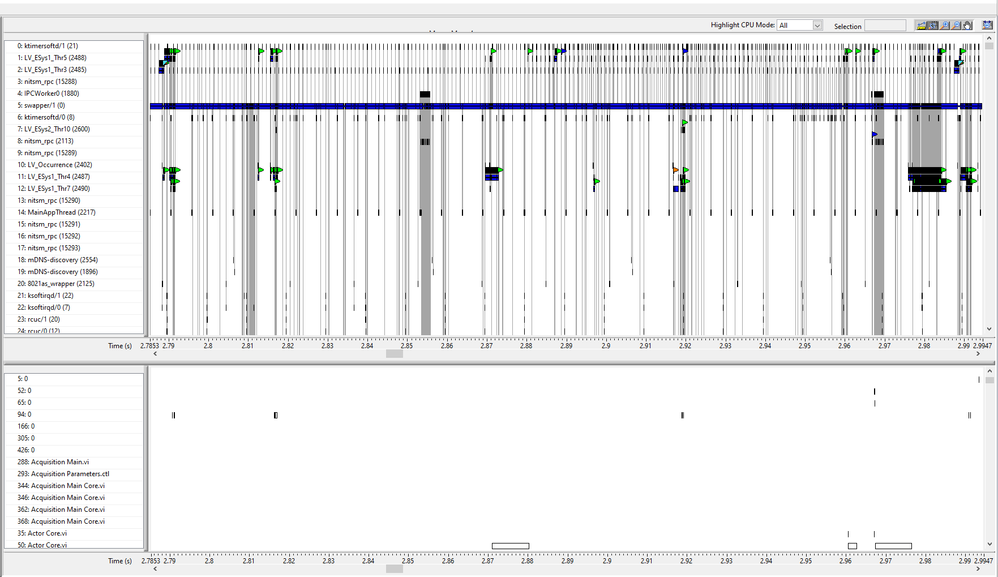
In the trace, I observe regular events for #0, but never see #4...

The flags are configured to use the upwards-pointing shape for 0-3, and downwards (with the same colours paired) for 4-7, so I'd expect between every pair of upwards pointing teal flags, there should be a downwards pointing teal flag (#4) indicating the end of the Acquisition Main Core.vi (of course there are more flags if I scroll down, predominantly the blue Sleep flags, but I didn't see any that were User #4).
Further, I'm confused as to why none of the Acquisition Main Core.vis or Acquisition Main appears to be active during this period (according to the VI trace).
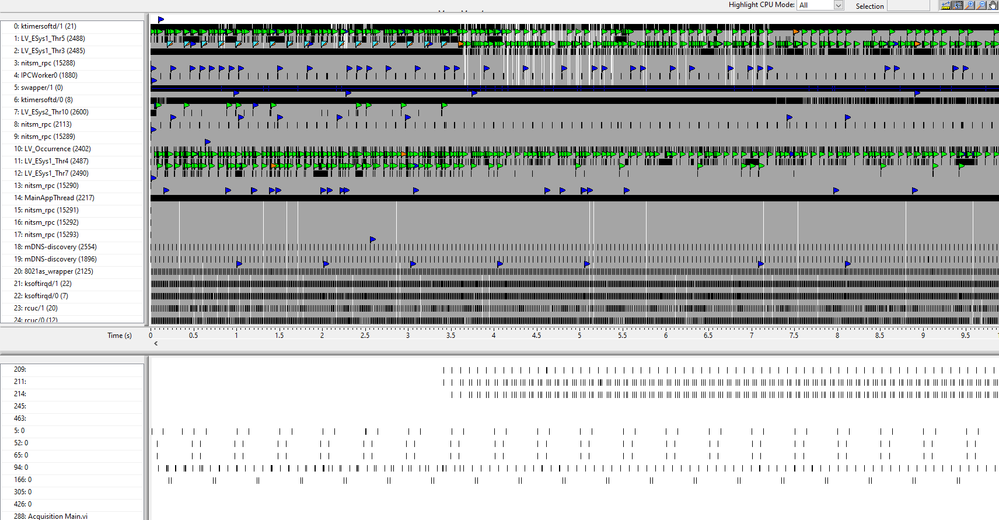
What are all of the "0" VIs? And in the full log (screenshot below) there are quite a few unnamed VIs with activity. I'm guessing these have something to do with reentrancy, but it would be helpful if I could extract something more than a guess from them...

Here the trace shows me stopping acquisition (hence no teal flags past about 4s in), but seemingly Stop.vi (not visible since sorted by name) is never called.
Does this mean my application is not doing remotely what I think it is, or does it mean the trace is not logging everything properly? Or is it something else?
As a final question, I have a huge number of green flags (memory manager waits) in this trace (and many others I've logged). This doesn't appear to be causing me any trouble, but is presumably a bad thing? How concerned should I be based on this blanket of green flags? I guess many of them are fairly trivial/small - but should I be trying to eliminate more of them, or am I ok so long as the main arrays and large blocks of memory are allocated in advance?
The full trace is attached in case that helps...
