- Subscribe to RSS Feed
- Mark Topic as New
- Mark Topic as Read
- Float this Topic for Current User
- Bookmark
- Subscribe
- Mute
- Printer Friendly Page
Investigating timing violations displays only non-diagram components
08-14-2014 11:30 AM
- Mark as New
- Bookmark
- Subscribe
- Mute
- Subscribe to RSS Feed
- Permalink
- Report to a Moderator
Hello All,
When I try to compile my FPGA application on LabView, I get timing violation errors. When I try to investigate them, LabView does not display the critical path; instead, there only are a litter of non-diagram components.
Here is my environment:
- LabView 2014 (32-bit)
- LabView Real-Time and FPGA Modules (2014)
- Xilinx Vivado (64-bit, 2014)
- NI FlexRIO 7975R FPGA board
My Question: Is there a way of configuring the compilation system to offer a more verbose output, that helps to identify the critical path on the block diagram?
Any pointers would be very useful indeed!
Thanks in advance.
Best,
Aditya
08-14-2014 11:39 AM
- Mark as New
- Bookmark
- Subscribe
- Mute
- Subscribe to RSS Feed
- Permalink
- Report to a Moderator
The non diagram components often refer to component level IP (CLIP) that is being used in your design. Whichever FAM you are using will have a socketed CLIP that it uses. Have you tried compiling the getting started example that goes with the FAM to verify basic functionality?
Also, are you using any user defined CLIPs of your own?
To answer your question directly, you can find greater detail on what failed by looking at the lvXinlinxLog.txt file that the compilation generates. If you have already closed out of the compilation window you can find it at "C:\NIFPGA\compilation".
08-14-2014 12:00 PM
- Mark as New
- Bookmark
- Subscribe
- Mute
- Subscribe to RSS Feed
- Permalink
- Report to a Moderator
Hello David,
Thank you for your response.
When I created my project, I right-clicked on "My Computer" and added the FPGA PXIe 7975R target. I am trying to compile my VI under this target, and have not yet played around with the actual hardware. Does the issue of FAM still arise in this case? (Forgive my ignorance).
To answer your second question: No, I do not have any user-defined CLIPs.
Finally, I examined the xilinx log, and correlated the non-diagram component names with the xilinx log. Unfortunately, I am still unable to glean information about which SubVI is the bottleneck, and what the critical path is.
Thanks!
best,
aditya
08-14-2014 12:29 PM
- Mark as New
- Bookmark
- Subscribe
- Mute
- Subscribe to RSS Feed
- Permalink
- Report to a Moderator
Hello again,
To add a little more information about which non-diagram components are listed. I've also shown the total delays for those non-diagram components of significant value
/cInOneFxpUns_inferred_i_2__21/O (0.91 ns)
/cInOneFxpUns_inferred_i_45/O (0.45 ns)
/cInOneFxpUns_inferred_i_37/CO[3]
/cInOneFxpUns_inferred_i_32/CO[3]
/cInOneFxpUns_inferred_i_27/CO[3]
/cInOneFxpUns_inferred_i_22/CO[3]
/cInOneFxpUns_inferred_i_17/CO[3]
/cInOneFxpUns_inferred_i_8__1/CO[3]
/cInOneFxpUns_inferred_i_4__1/CO[3]
/cInOneFxpUns_inferred_i_2__3/O[0]
/n_SubVI_Forward_FFT_Wrapper_vi_1281/n_FFT_1_vi_colon_Clone6/n_SubVI_192/n_SubVI_niFpgaFFTStreamingOutputControlLogic_vi_168/n_SubVI_niFpgaFFTStreamingOutputControlUnit_vi_108/n_Add_402/GenFixed.NiLvFxpAddx/MuxAfterRegister.cRegArray[0][3]_i_6/O (0.56 ns)
/n_SubVI_Forward_FFT_Wrapper_vi_1281/n_FFT_1_vi_colon_Clone6/n_SubVI_192/n_SubVI_niFpgaFFTStreamingOutputControlLogic_vi_168/n_SubVI_niFpgaFFTStreamingOutputControlUnit_vi_108/n_Add_402/GenFixed.NiLvFxpAddx/MuxAfterRegister.cRegArray_reg[0][3]_i_2/CO[3]
/n_SubVI_Forward_FFT_Wrapper_vi_1281/n_FFT_1_vi_colon_Clone6/n_SubVI_192/n_SubVI_niFpgaFFTStreamingOutputControlLogic_vi_168/n_SubVI_niFpgaFFTStreamingOutputControlUnit_vi_108/n_Add_402/GenFixed.NiLvFxpAddx/MuxAfterRegister.cRegArray_reg[0][5]_i_4/O[1]
/InitializableDualPortRamx_i_6/O
/FPGAwMemoryn14x/FpgaMemoryBlockFPGAwMemoryn14x/InitializableDualPortRamx/U0/inst_blk_mem_gen/gnativebmg.native_blk_mem_gen/valid.cstr/ramloop[0].ram.r/prim_noinit.ram/DEVICE_7SERIES.NO_BMM_INFO.SDP.WIDE_PRIM36.ram (0.47 ns)
Essentially, I see that some of the components are a part of my implementation that deal with FFTs. But, I am still unclear about how I can go about reducing these delays to increase the clock speed supported. Thanks again.
best,
aditya
08-14-2014 01:25 PM - edited 08-14-2014 01:25 PM
- Mark as New
- Bookmark
- Subscribe
- Mute
- Subscribe to RSS Feed
- Permalink
- Report to a Moderator
Are you able to compile the FFT example that ships with FlexRIO? You can find it by opening the example finder and navigating to Hardware Input and Output>>FlexRIO>>FPGA Fundamentals. If that works then you could try comparing what you see there to what you are implementing.
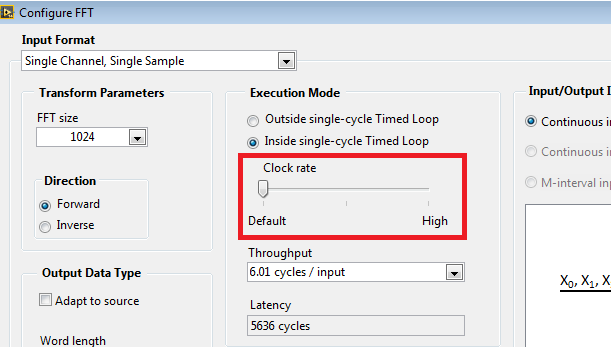
One of the first things I would take a look at is the clock rate that your FFT has been configured to operate at. You may want to try setting it for a higher clock rate, which will increase its latency, but make it easier to meet timing.
08-14-2014 06:23 PM
- Mark as New
- Bookmark
- Subscribe
- Mute
- Subscribe to RSS Feed
- Permalink
- Report to a Moderator
Hello David,
Thank you for your suggestions. Yes, I am able to successfully compile the examples, and some smaller FPGA projects that I have created.
Next, regarding the FFT block (and the clock rate option): When I changed the clock rate setting from "Default" to "High", the maximum supported frequency actually decreased by about 15MHz. This is weird, isn't it? Another weird thing that I've noticed is that for the exact same source VIs, if I compile it multiple times, the maximum supported clock rate each time varies a little bit.
And finally, another observation: Under Xilinx Options, if I change the setting from "Default" to "Optimize Performance", the maximum supported clock rate decreases. Any pointers about how I can consistently get the best compilation outcomes?
Thanks again for your time and suggestions.
Best,
Aditya

