- Subscribe to RSS Feed
- Mark Topic as New
- Mark Topic as Read
- Float this Topic for Current User
- Bookmark
- Subscribe
- Mute
- Printer Friendly Page
Print NIVS Debug String.vi in a Model
03-14-2012 08:43 PM - edited 03-14-2012 08:50 PM
- Mark as New
- Bookmark
- Subscribe
- Mute
- Subscribe to RSS Feed
- Permalink
- Report to a Moderator
Is the Print NIVS Debug String.vi supposed to work if used within a LV model? I am trying to debug a model, and use this VI without result... If it doesn't how can I debug a LV model..., beside trial and error based on inputs, outputs, and using the Fault Manager tool to force inputs? Thx.
L.
03-15-2012 09:27 AM
- Mark as New
- Bookmark
- Subscribe
- Mute
- Subscribe to RSS Feed
- Permalink
- Report to a Moderator
The Print NIVS Debug String VI is intended to be used in Custom Devices. It is not working because LV Models are built into a DLL, which causes it to run in a different application context.
However, there is a good way to debug LV Models. It will require some manual work (and it's a process we want to improve in future versions), but it actually ends up with a very good debugging experience in which you can attach to VeriStand from LabVIEW and do remote debugging. Follow these steps:
1. Open the Generate NI VeriStand Model from VI dialog for your source VI.
2. Click the Options button and check the checkbox for Retain Intermediate Files in Destination Folder.
3. Build your lvmodel.
4. Go to the destination folder and open the project called lvsv_template_project.lvproj. This project contains the build specification to build the DLL that comprises your lvmodel.
5. Open up the My DLL build specification and check the Enable Debugging option in the Advanced category. (Note: Your source VIs must still have debugging enabled for all this to work.)
6. Build the My DLL build specification.
7. Locate the DLL that it built, called lvsim_veristand.dll. Rename this file to your desired lvmodel name with extension .lvmodel. The extension needs to be lvmodel for the model to be executable in VeriStand.
8. Open up the ini file located next to the lvmodel called lvsim_veristand.ini. Update the Section name from lvsim_veristand to the name of your model file without extension.
9. Rename the ini file itself to the same name as your model file with extension ini.
10. Add the model to your system definition in VeriStand and run your project.
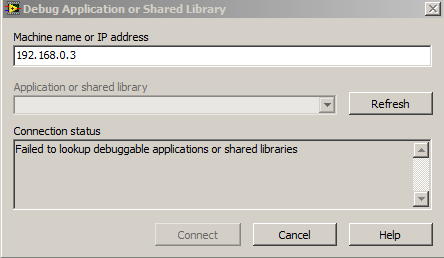
11. Return to LV and close all open VIs (not required but helps keep things simple). Select the menu option Operate >> Debug Application or Shared Library. If your model is running you should see it in the list of available debugging apps. Select OK to start remote debugging.
12. At this point you can use breakpoints, probes, highlighted execution, etc.
Another option if this is too much of a pain is to debug your lvmodel in the PC Engine simply by having the VI open its front panel on first call. Then when you run the model the front panel will load and you can see controls and indicators and interact with your model in that way. You can't get to the block diagram, but it's better than printing debug messages I suppose. You can probably even do this same trick on an RT Target using Remote Front Panels.
National Instruments
03-15-2012 12:07 PM
- Mark as New
- Bookmark
- Subscribe
- Mute
- Subscribe to RSS Feed
- Permalink
- Report to a Moderator
Thx Jarrod.
Working on this... Are you assuming the VS engine runs on a Windows PC, or a RT Target (my case here)? So far, I do not see the model in the list of debuggable applications. I confirm it is running in the VS engine, as indicated on the VS status screen.
Still trying...
L
03-15-2012 12:34 PM
- Mark as New
- Bookmark
- Subscribe
- Mute
- Subscribe to RSS Feed
- Permalink
- Report to a Moderator
Still no luck. As far as the remote panel on a RT target. I am not aware the RT target running VS engine supports the remote panel server. Does it ?
L
03-15-2012 01:40 PM
- Mark as New
- Bookmark
- Subscribe
- Mute
- Subscribe to RSS Feed
- Permalink
- Report to a Moderator
I got it working on a PC Engine. I have not tried this on RT before. RT does support remote debugging for a debug-enabled rtexe, but I am not sure if it works for a debug-enabled DLL loaded in that environment.
Remote panels should work for custom devices and models on RT, but there's another set of steps to get it working. What I've done before is to deploy a LabVIEW project to the RT Target with the correct VI Server permissions set. This obviously unsets the VeriStand Engine from running as the startup executable. But then after that you can reinstall VeriStand support from MAX and I believe the VI Server permissions persist. This allows you to view remote panels if you know the exact qualified name of the VI you want to open. Finding that out can be tricky, especially if the VI is reentrant, because you need its clone name (i.e. "mylibrary.lvlib:myVI.vi:2").
National Instruments
03-15-2012 01:52 PM
- Mark as New
- Bookmark
- Subscribe
- Mute
- Subscribe to RSS Feed
- Permalink
- Report to a Moderator
Wow... this lack of workable model debugging is something NI should work out a solution for, because with the approach you are describing it turns out to be more of a hassle than the bug itself. I will start a separate thread with regards to the actual issue.
Thx for helping on this.
L.
02-21-2013 12:06 PM
- Mark as New
- Bookmark
- Subscribe
- Mute
- Subscribe to RSS Feed
- Permalink
- Report to a Moderator
Hello Jarrod,
Found my way here because I am investigating options for debugging custom devices. Looks like this thread got off topic, but I do have a question about the VI itself: What format (or data type) is the "Debug String" input supposed to be? Not sure if I am supposed to send it the error cluster, or some other information. I would dig into the VI to see what it is looking for myself, but the block diagram is password protected. Please advise.
Thanks much,
GSinMN
02-21-2013 12:40 PM
- Mark as New
- Bookmark
- Subscribe
- Mute
- Subscribe to RSS Feed
- Permalink
- Report to a Moderator
Realize I may have answered my own question. As implied by the name, the format type is "string". That means whatever data I want to be displayed in the console must first be converted into a string (possible with the "format into string" vi).
Still, I'm curious to know the internal workings of the Print NIVS Debug String vi. I haven't found any other functions that call the console window, and would like to know how it is accomplished.
Thanks
GSinMN
02-22-2013 09:16 AM
- Mark as New
- Bookmark
- Subscribe
- Mute
- Subscribe to RSS Feed
- Permalink
- Report to a Moderator
The Print NIVS Debug String VI is mostly just a wrapper around the VI that installs with the LabVIEW Real-Time Module called RT Debug String. This VI is responsible for printing the string contents to the RT target console output. You could just call that VI directly. However, the VeriStand version does have some additional functionality:
1. The VI also logs the text to the current log file on the target. This is helpful, since the console can only display so many lines.
2. The VI also supports printing the contents from the PC Engine, where there is no RT console output. You can use the Console Viewer utility to view this virtual console for PC Engines.
National Instruments
02-22-2013 09:42 AM
- Mark as New
- Bookmark
- Subscribe
- Mute
- Subscribe to RSS Feed
- Permalink
- Report to a Moderator
Good Morning Jarrod,
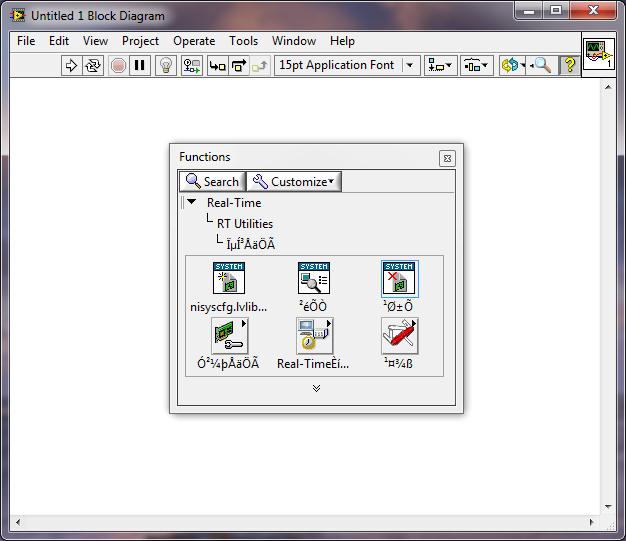
Thanks for the response. I thought it would have been something easy to find like that, but when I did a search on the quick-drop pallette nothing even close came up. That's why I posted to question. Today I figured out why I couldn't find the related VIs. My RT utilities pallete looks like this:
The filenames for the sub VIs are junk. Any idea how this happened, or how to correct it?
Thanks,
GSinMN


