- Subscribe to RSS Feed
- Mark Topic as New
- Mark Topic as Read
- Float this Topic for Current User
- Bookmark
- Subscribe
- Mute
- Printer Friendly Page
CAN frames being skipped
11-13-2017 04:59 AM
- Mark as New
- Bookmark
- Subscribe
- Mute
- Subscribe to RSS Feed
- Permalink
- Report to a Moderator
Hi,
I am using 2 dual can cards -for a total of 4 CAN buses- in a project where I have a model that controls the transmission of CAN frames. Each of the buses have their own set of frames defined in the associated databases. Each bus carries about 100 different Tx frames (and the same amout of Rx) for a total of ~1000 frames. The Tx speed is 400Hz, with between 1 and 15 frames transmitted every 2,5ms.
My problem: There are frequently missed frames, e.g. my model commands that frames are send in the follwing order and timing:
t = 1, Tx = frame1
t = 2, Tx = frame2
t = 3, Tx = frame3
t = 4, Tx = frame4
t = 5, Tx = frame5
t = 6, Tx = frame6
But I will observe the following on the physical bus (using CANoe):
t = 1, Tx = frame1
t = 2, Tx = frame2
t = 6, Tx = frame6
Problem is not on the CANoe side, because I'm way below the sample speed limit of it.
I tried looking into the documentation but there is no mention to the load limit of bus CAN: http://www.ni.com/pdf/manuals/372840l.pdf
Configuration :
- NIVS 2015 SP1 (NI-XNET 2015 SP1)
- Hardware chassis NI PXI-1044
- Controller NI PXI-8840
- 2x CAN cards NI PXI-8512
11-13-2017 07:07 AM - edited 11-13-2017 07:27 AM
- Mark as New
- Bookmark
- Subscribe
- Mute
- Subscribe to RSS Feed
- Permalink
- Report to a Moderator
Oh I forgot to ask a question: does anyone know how I can prevent the behavior of skipped CAN frames? I would like some advice from anyone that has encountered issues with CAN bus load or that knows where the limitation comes from -is it VeriStand or is it the PXI-8512?-
The issue is not the processor load either. My load stats are:
CPU# // Total Load // ISRs // Timed Structures // Other Threads
0 // 38% // 6% // 15% // 15%
1 // 65% // 0% // 60% // 9%
11-14-2017 11:33 AM
- Mark as New
- Bookmark
- Subscribe
- Mute
- Subscribe to RSS Feed
- Permalink
- Report to a Moderator
What is the execution rate of your Primary Control Loop in VeriStand? What is the decimation of your model? What are the transmit times of your CAN frames in their database?
You mentioned using CANoe? What are you using CANoe for? Is that how you generated your CAN databases, or are you using it to read and write on the CAN ports while VeriStand is running?
National Instruments
Staff Applications Engineering Specialist
11-16-2017 07:54 AM - edited 11-16-2017 07:55 AM
- Mark as New
- Bookmark
- Subscribe
- Mute
- Subscribe to RSS Feed
- Permalink
- Report to a Moderator
Hi Miles,
Here are the relevant settings of my project:
Controller NI 8840 > Timing Source Settings > Primary Control Loop timing source: Automatic timing
Controller NI 8840 > Timing Source Settings > Target Rate: 2000 Hz
MyModel > Model Settings > Decimation: 5 (Rate: 400 Hz)
In terms of CAN frames, I use one database per CAN bus. Each of these frames is set with the following parameters:
MyFrame > Transmission Trigger > Transmit trigger: Trigger channel (not zero)
MyFrame > Transmission Trigger > Trigger channel: ControlArrayComingFromMyModel(1,N)
MyFrame > Transmission Trigger: Software cyclic trigger disabled
The signals of ControlArrayComingFromMyModel control between 1 and ~15 frames to be sent at the same time after one model execution cycle.
Concerning my interface with the PXI8512, the CAN bus is connected to a CANcaseXL then to the PC, where I can perform two operations at the same time:
1. Monitor CAN traffic using CANoe
2. Interface the CAN model with my custom program, which will discuss with the CAN model that runs in veristand (VeriStand master / custom program slave)
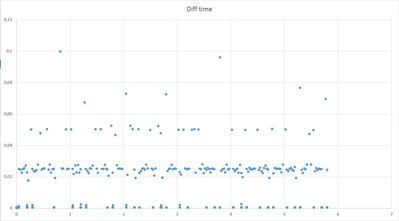
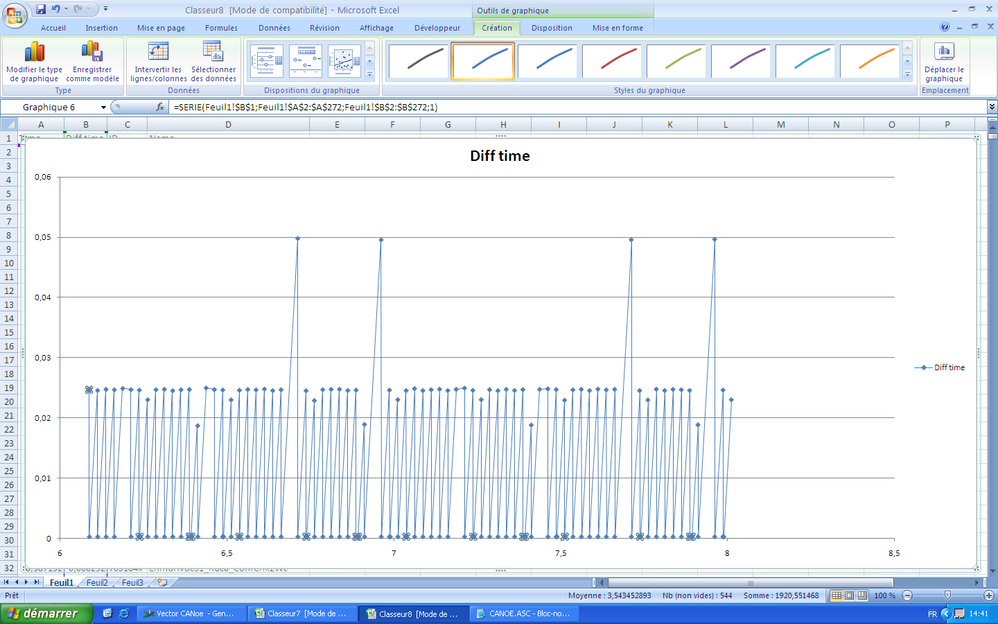
In the current situation I am not using my interface, but only CANoe, to monitor transmission timings of the RT-Target Tx frames. This is where I observe that the transmission is lost at uncontrolled times. In the following figure, X represents a frame reception time and Y represents the time since last reception. My model controls new data transmission each 25ms, this reflects in the thick line at Y = 0,025. The points around Y = 0 are expected and represent the cases where several frames are sent at the same time. My problem is that I have points around Y belonging in {0,050; 0,075; 0,100} meaning that there are missing transmissions (respectively 1, 2, 3 frames lost)
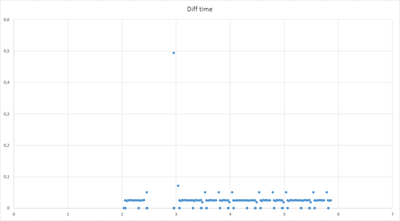
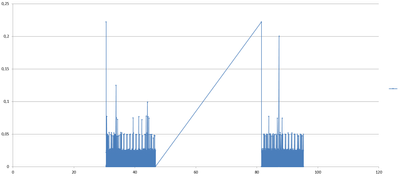
In the following figure we can see that the communication is completely muted for a few moments before resuming normaly, this has been recorded on Real-Time execution start:
I've been advised to try and use the XI-NET Bus Monitor but even though I managed to connect to the remote CAN devices, there are no frames to be seen in the monitor.
Alternatively I used a scope to monitor an outgoing periodic frame in VeriStand. The observation is that the signal behaves in value and timing as expected (no frames missing), but then when I observe the CAN bus traffic there are frames missing.
At this point the problem is either in the PXI-8512 or on the observator side with my CANoe, I suspect it has something to do with the capabilities of the PXI-8512 because CANoe should be robust at these standard bus loads and rates.
I observed that sometimes CANoe behaves differently depending on the logging mode. This is in favor of putting the blame on CANoe and would be a reassuring news regarding the integrity of my VeriStand setup, but this conclusion needs to be confirmed.
11-16-2017 10:22 AM
- Mark as New
- Bookmark
- Subscribe
- Mute
- Subscribe to RSS Feed
- Permalink
- Report to a Moderator
Hi FrankYin,
did you install the patch mentioned here?
Could be that you have similar issue as I had with VS2015SP1. So if you haven't installed the patch yet, it could be worth a try.
Regards
Dirk
11-17-2017 04:38 AM - edited 11-17-2017 04:55 AM
- Mark as New
- Bookmark
- Subscribe
- Mute
- Subscribe to RSS Feed
- Permalink
- Report to a Moderator
Hi Dirk,
Thank you for your suggestion. It is not clear what the exact conclusion of the experiment presented in your post should be, except that there can be an undesired interaction between 'cyclic' and 'event triggered' frames. I am only using 'triggered frames' myself so the 'cyclic' frames issue should not impact me.
In the current state of the project I'm not comfortable with switching the VeriStand version up to 2016.
@Kilometers
I traced the CAN traffic again in CANoe and got a better confirmation that the frame transmission are indeed missing on the bus -instead of not being recorded by CANoe- by evaluating the bus load (5%) and using the file logging capability of CANoe.
I have configured each of the ports in HS -High Speed mode. According to the specification, the used components are ISO 11898 compatible TJA1041 and TJA1043. In my configuration I'm only using one device other than the PXI-8512 on the bus and all things considered I have a pretty standard setup for a CAN transmission. I have for now put aside the following possibilities:
- CANoe trace failure
- VeriStand data failure (I observed that the data always takes the expected values at the expected times in the can signals 1 and 2)
This points towards a VeriStand Tx command failure. This will be my next approach.
11-17-2017 08:23 AM
- Mark as New
- Bookmark
- Subscribe
- Mute
- Subscribe to RSS Feed
- Permalink
- Report to a Moderator
A piece of information is missing in what I described to know why my model executes at 400Hz, T=2,5ms and the time difference between frames is 25ms.
The model loop is called with T = 2,5ms, for a frequency of f = 400Hz. But the frame reception time differences aggregate around 25ms because I'm using 10 cycles for my can communications, with respective bus management:
windows 1 and 2, manage CAN1 Tx
windows 3 and 4, manage CAN2 Tx
windows 5 and 6, manage CAN3 Tx
windows 7 and 8, manage CAN4 Tx
windows 9 and 10, do nothing.
The figures of my other post show the traffic on CAN1, I am therefore expecting time differences of 2,5ms on one hand (time difference between windows 1 and 2) and 22,5 / 25ms on the other (length of a cycle of 10 windows).
I will try to narrow the problem down by reproducing the behavior with a simple project.
11-21-2017 11:19 AM
- Mark as New
- Bookmark
- Subscribe
- Mute
- Subscribe to RSS Feed
- Permalink
- Report to a Moderator
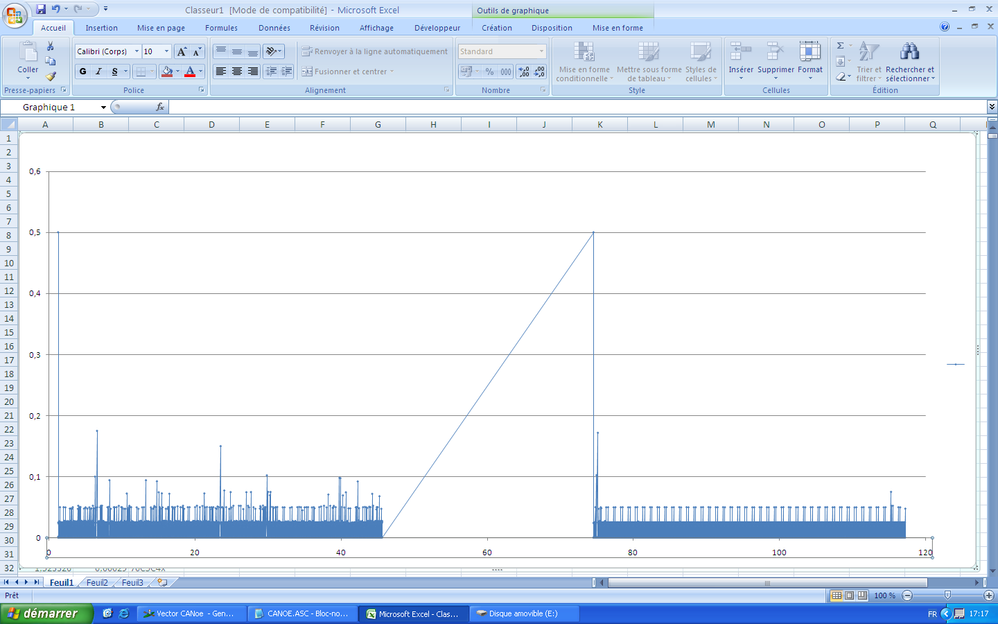
After further investigation (many traces of starts restarts and project parameter tweaking), I have identified that the frame skipping occurs only on the first deployment after the Real Time Target is turned on. In the following trace the first part is the first Run after the chassis is powered up, the timings are messy. The consecutive void is when I use the command "Operate > Undeploy". The second part of the measurement is after I use the Run command a second time, the timings are mostly accurate and way better than in the first trace.
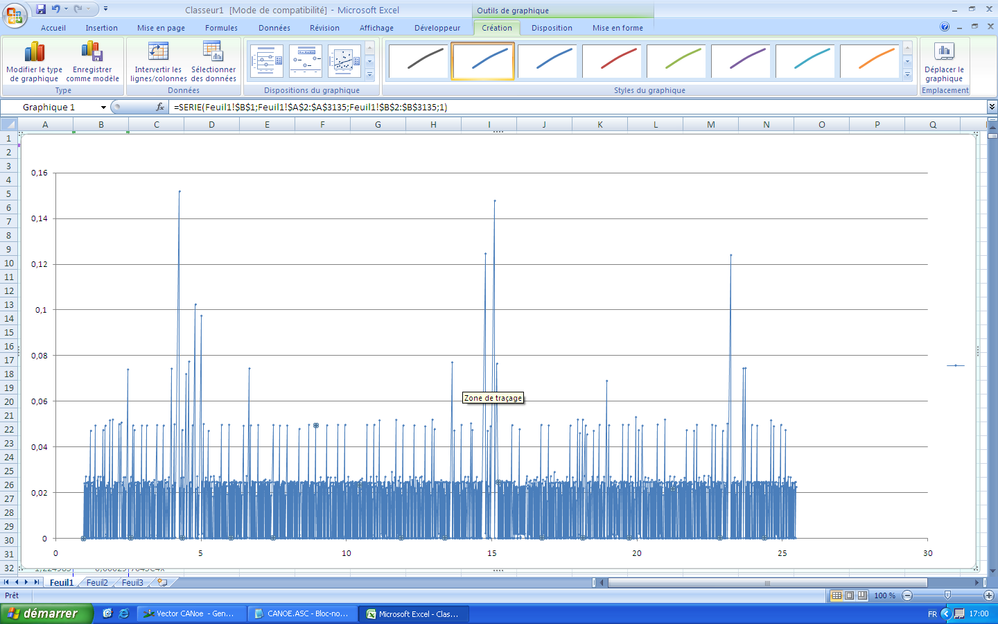
From two other measures, this is the close up of what the scheduling looks like when it's messy versus what it looks like when it's accurate (respectively short time span and very short time span)
This sequence is exactly what I'm looking for, obtained by Deploying after the first Deployment after power on.
For the time being, I will circumvent this problem by performing a blank Deploy before doing my experiments, but it would be nice if anyone could find the precise reason why this happens.
11-28-2017 10:12 AM - edited 11-28-2017 10:32 AM
- Mark as New
- Bookmark
- Subscribe
- Mute
- Subscribe to RSS Feed
- Permalink
- Report to a Moderator
Hello everyone again,
I came back on this issue for 2 reasons:
1. Deploying the project a second time is not a surefire way to get a correct execution (see trace below)
2. I have unwanted frame losses even when the project is behaving in a non-erratic way (see end of trace of first picture of my previous post)
Both are problems I need to adress moving forward.
Figure1. Frame skipping even on second Deployment
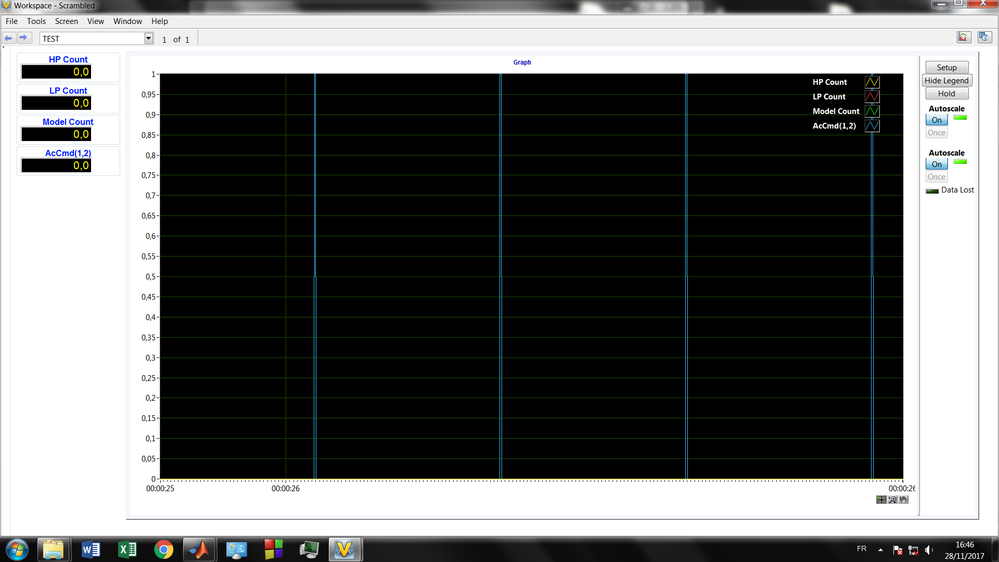
I have been advised by the support to watch three specific variables :
- HP COUNT
- LP COUNT
- MODEL COUNT
Which are used to track unfinished cycle executions.
Here's my trace (to which I added a custom signal to make sure the scope was alive)
Figure2. Error counters remain zero
I also created a DLL where there is a 10s temporisation and tested it but it exhibited the same failing behaviour.
Any hint on where I should investigate next is welcome.
01-24-2020 05:41 AM
- Mark as New
- Bookmark
- Subscribe
- Mute
- Subscribe to RSS Feed
- Permalink
- Report to a Moderator
Hello
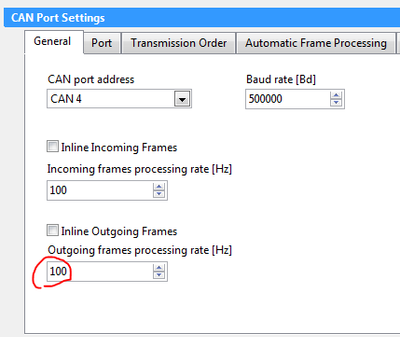
You have to check CAN port physical layer configuration :
