- Subscribe to RSS Feed
- Mark Topic as New
- Mark Topic as Read
- Float this Topic for Current User
- Bookmark
- Subscribe
- Mute
- Printer Friendly Page
Memory Leak in File Writes?
03-11-2014 03:49 PM
- Mark as New
- Bookmark
- Subscribe
- Mute
- Subscribe to RSS Feed
- Permalink
- Report to a Moderator
We have noticed a strange effect in our code on the 9068 that is not present on other cRIO (or Windows) platforms.
It seems some memory is allocated when opening, writing to a file, and closing the file and is never released and if you do this enough you will run out of memory. We created a simple VI that loops through creating files and you can watch in distributed system manager the memory shoot up. The amount of memory allocated is directly related to the size of the data you write to disk. This leak is present for all file writes (TDMS, Binary, DataLog, etc..).
The memory is not released until you actually delete the files. The OS does not report that the LV runtime is consuming the memory.. it's just gone somewhere else. Killing the LV runtime process does not release the memory. The other strange thing is that although it consumes all the memory, it doesn't crash the system, it saturates at 100% but continutes to run.
We are working with an NI AE on this, but I thought I'd ask to see if anyone else has run into this? We are working around this currently by limiting the number of log files and when we hit the limit deleting the oldest file. It deletes the file on disk and also releases the memory associated with that file.
Attached is a simple VI if you deploy to a 9068 and watch in distributes system manager you can see the memory fly up.
Thanks,
Graham
03-11-2014 03:57 PM
- Mark as New
- Bookmark
- Subscribe
- Mute
- Subscribe to RSS Feed
- Permalink
- Report to a Moderator
Hi Graham,
Is the program still running just fine? This could be attributed to the way LabVIEW reports memory usage on the NI Linux Real-Time Operating System. Linux reports memory usage in a unique manner that is different from other operating sytems. There is a Knowledgebase article here that I would suggest you take a look at and see if that matches what you are seeing with your application. If so, you may be able to safely disregard the memory allocation you are seeing and continue as normal. If you do run into any crashes or memory allocation issues otherwise, then you are going down the right path to work with NI AE.
03-11-2014 04:09 PM
- Mark as New
- Bookmark
- Subscribe
- Mute
- Subscribe to RSS Feed
- Permalink
- Report to a Moderator
That's correct the program still runs fine. It's too bad that LV reports it this way, if we want to present the memory usage for our users it is a bit disconcerting to see it maxed out. That all makes sense though, thanks for the help.
Graham
03-11-2014 04:18 PM
- Mark as New
- Bookmark
- Subscribe
- Mute
- Subscribe to RSS Feed
- Permalink
- Report to a Moderator
Graham,
I think the way memory usage is reported for NI Linux Real-Time targets in LabVIEW is being looked into for the future. For the current distribution of our NI Linux Real-Time OS that was a feature that did not turn out perfect on the first roll-out. The NI Linux Real-Time OS is full of great features, but with it being released less than a year ago there are still small components that could be improved to make it that much better. A lot of our developers love to look through these forums, so posting here was a great idea! I am in agreement that the article I linked sounds very similar to what you are seeing, but let us know if you do run into any system hangs or crashes due to memory allocation and we will help out! Have a great day.
03-12-2014 11:47 AM
- Mark as New
- Bookmark
- Subscribe
- Mute
- Subscribe to RSS Feed
- Permalink
- Report to a Moderator
We actually implemented a fairly simple workaround for now if anyone else is interested. Most of this information can be easily parsed out of the /proc/meminfo file on the 9068. There are other things that can be pulled from here also. I attached a VI that gives you Free Memory more accurately. This can be easily extended for other parameters just google "/proc/meminfo".
Graham
03-12-2014 07:40 PM
- Mark as New
- Bookmark
- Subscribe
- Mute
- Subscribe to RSS Feed
- Permalink
- Report to a Moderator
Graham Beauregard wrote:
I attached a VI that gives you Free Memory more accurately. This can be easily extended for other parameters just google "/proc/meminfo".
It looks like you're computing free memory as (MemFree+Buffers+Cached). Yes, that is what the common wisdom of the Internet says you should do; yes, this there are good reasons for doing it that way; no, it is not the correct formula for NI Linux Real-Time 2013, and is likely to overestimate the amount of free memory by a significant amount.
The formula we're using nowadays is:
(Free memory that LabVIEW RT can allocate) = (CommitLimit-Committed_AS)*(31/32) - (VmSize/32) EDIT:
(Free memory that LabVIEW RT can allocate) = (CommitLimit)*(31/32) - (VmSize/32) - Committed_AS
… where CommitLimit and Committed_AS are from /proc/meminfo, and VmSize is from /proc/self/stat.
The rationale behind this formula is a bit obscure, and involves the Linux kernel's heuristics about how much memory a process is allowed to allocate, along with the particular way we are configuring memory overcommit. I can provide go into more detail if you're curious.
In lieu of a DSM that uses this new formula, I've tweaked your VI to use this formula. (And I see that you, too, have also run into issue# 112702.  )
)
Disclaimer: totally unsupported, not well tested, these formulas may change without notice in any future release, yadda yadda yadda. Basically you should be moving back to NI-provided APIs for this stuff as soon as it is practicable to do so, because we really are making an effort to hide this complexity from you. (I like to think so, anyway.)
Fixed an error spotted in the free memory formula; I was underestimating the free memory by Committed_AS/32. Both the formula and the VI have been updated.
11-14-2014 11:59 AM
- Mark as New
- Bookmark
- Subscribe
- Mute
- Subscribe to RSS Feed
- Permalink
- Report to a Moderator
I also see the allocation of cache memory for TDMS file writes. As a developer trying to avoid memory leaks in an application, I needed a better way see memory usage on Linux RT targets without it being obscured by extra "fictitious" allocations (if I am correct that this is the case). The issue of over-reporting memory usage was less of a factor to me than understanding if the application memory usage is growing (an actual memory leak). The good news is, we have found at least one way to improve reporting of memory.
When I allowed this reported memory usage to grow, it eventually "hovers" at around 99%, and for this reason I looked for a way to clear the falsely reported memory usage periodically (at a threshold, say 50%). This can be done by freeing pagecache, dentries and inodes as an admin user (not lvuser) from the command line with the following command:
echo 3 > /proc/sys/vm/drop_caches
I issued this command to a running cRIO-9031 target successfully using Putty. Of, course, it would be great to do this from LabVIEW right? It turns out that Linux security features prevent us from issuing this command directly, as lvuser, using the system exec VI. At least for this particular command, it has to be in a script file, whose owner is set to root, and this script file can then be called by the system exec VI.
I have not yet written the script file (little experience here), so assistance here would be greatly appreciated. My inital script file looks like this:
clearcache_script.sh (not functional)
#!/bin/bash
# Clear pagecache, dentries, and inodes memory.
echo 3 > /proc/sys/vm/drop_caches
Thanks!
Lee
11-14-2014 12:17 PM
- Mark as New
- Bookmark
- Subscribe
- Mute
- Subscribe to RSS Feed
- Permalink
- Report to a Moderator
If you're just needing to check if LV is leaking memory, you can get the memory usage of LV itself various ways, for example "cat /proc/`pidof lvrt`/status" (which you can also read programatically by opening that file, or more computer-friendly versions of the same data such as "stat", from /proc/self while inside LV) which works fine as lvuser. Monitoring that should be quite a bit more accurate as a way to check for LV memory leaks than any system-wide statistic.
09-21-2015 04:01 AM
- Mark as New
- Bookmark
- Subscribe
- Mute
- Subscribe to RSS Feed
- Permalink
- Report to a Moderator
I get the same problem recently, I moved to Labview real time 2014 and it seems to be ok
02-29-2016 05:51 AM
- Mark as New
- Bookmark
- Subscribe
- Mute
- Subscribe to RSS Feed
- Permalink
- Report to a Moderator
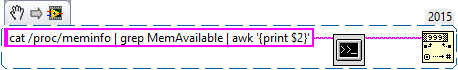
We have been using this code to retrieve free memory, as labview node doesn't report the real available memory.
This returns the memory value in kB.