- Document History
- Subscribe to RSS Feed
- Mark as New
- Mark as Read
- Bookmark
- Subscribe
- Printer Friendly Page
- Report to a Moderator
- Subscribe to RSS Feed
- Mark as New
- Mark as Read
- Bookmark
- Subscribe
- Printer Friendly Page
- Report to a Moderator
Overview
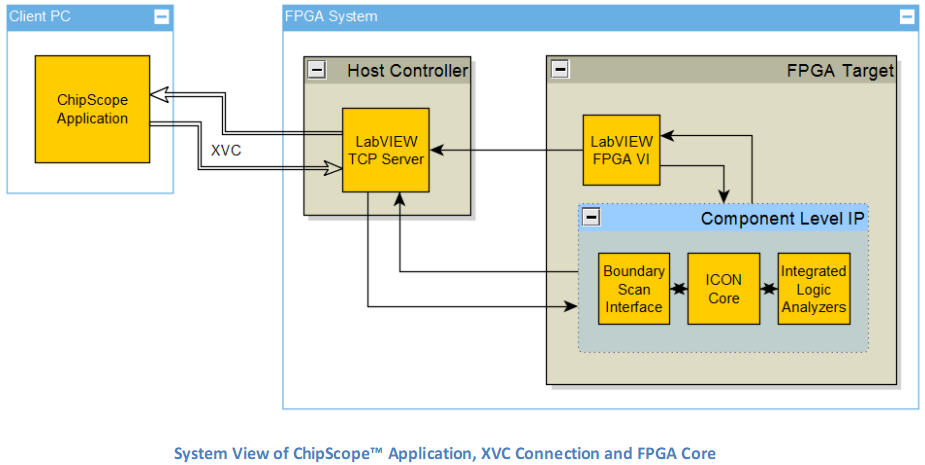
This document describes how to incorporate Xilinx® ChipScope™ into a LabVIEW FPGA design and use the Xilinx® Virtual Cable (XVC) protocol to emulate a JTAG interface over TCP. This allows remote or local ChipScope™ debugging within a LabVIEW FPGA application without having to make any physical JTAG connections or use any physical cable connects. ChipScope™ is an FPGA (Field Programmable Gate Array) debugging tool provided by Xilinx for generating logic analyzer cores to be used on your FPGA, which allows probing and triggering signals in the FPGA. Using the LabVIEW FPGA CLIP Node, you can instantiate these cores in your designs to perform on-chip debugging of LabVIEW FPGA designs. For additional information on Xilinx® ChipScope™, see http://www.xilinx.com/tools/cspro.htm.
For remote access, the ChipScope™ application runs on a client computer and communicates with the TCP/IP server running on the host controller. This server in turn interacts with the Logic Analyzer core inside the FPGA’s Component Level IP (CLIP). The flexibility of this server is that it can run on any machine that is host to the FPGA target you are wishing to debug; this can be anything from a simple local-loopback on the same host PC to an Internet connected Real-Time controller in a PXI chassis that is setup halfway around the world.
Requirements
- LabVIEW 2013 or later
- LabVIEW 2011 Runtime Engine
- LabVIEW FPGA Module
- LabVIEW Xilinx ISE Compile Tools **
- LabVIEW FPGA Hardware Target to debug
** If targeting a Kintex-7 Device in LV 2014 or later, LabVIEW 2013 Xilinx ISE Compile Tools must also be installed (ISE 14.4)
Procedure
- Download XVC ChipScope Debugging.zip from the attachments section
- Unzip and follow instructions listed in Remote FPGA Debugging with ChipScope™, XVC and LabVIEW.pdf

