- Subscribe to RSS Feed
- Mark Topic as New
- Mark Topic as Read
- Float this Topic for Current User
- Bookmark
- Subscribe
- Mute
- Printer Friendly Page
x scale changes randomly with real time signal.
12-24-2017 11:40 PM
- Mark as New
- Bookmark
- Subscribe
- Mute
- Subscribe to RSS Feed
- Permalink
- Report to a Moderator
hi,
i am using labview 2017(64 bit) and reading multiple channel analog signal with usb-4716 ADVENTECH with DAQnavi assistant and displaying signal on waveform chart.
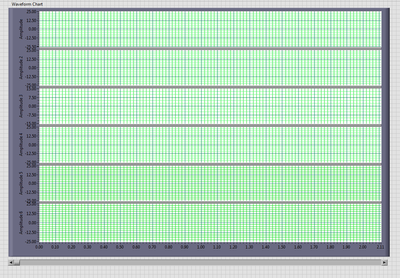
i have set y-axis scale according to the requirement but the problem comes when i set x-axis ,i need to set range from 0-2.11 and want to have minor increment of 0.0064 and increment of 0.032 ,so as i need to have 333 small boxes within the range of 0 to 2.11 but when i RUN my VI , it starts to flicker and when i stop VI and use x scrollbar it auto set the x-axis range. auto scale x-axis is off.
i am sharing a VI, please have a look and suggest some solutions.
12-25-2017 02:22 AM
- Mark as New
- Bookmark
- Subscribe
- Mute
- Subscribe to RSS Feed
- Permalink
- Report to a Moderator
Dynamic data typically contains x-scale timing information. Do you know what it is?
- What is the purpose of the FOR loop? Makes no sense?
- What is the purpose of the combo box and case structure? Also makes no sense.
- Why are you running three property nodes in parallel? Wouldn't one big property node be sufficient?
- Since the controls are constant, wouldn't setting them once before the main while loop be sufficient?
- How many points are added to the scale with each iteration? Shouldn't the range change once the chart history is filled up?
- Any particular reason you are using 64bit LabVIEW?
12-25-2017 03:06 AM
- Mark as New
- Bookmark
- Subscribe
- Mute
- Subscribe to RSS Feed
- Permalink
- Report to a Moderator
I am using FOR loop and case structure because i have many different cases in my actual VI where i have to set different ranges of y scale depending upon the case but here i just shared a single case as i have issues regarding x-scale.
12-25-2017 08:34 AM
- Mark as New
- Bookmark
- Subscribe
- Mute
- Subscribe to RSS Feed
- Permalink
- Report to a Moderator
Try to uncheck the "Auto Adjust Scales" in Advanced property of the graph. I don't have your hardware to try it out myself.
12-25-2017 11:33 AM
- Mark as New
- Bookmark
- Subscribe
- Mute
- Subscribe to RSS Feed
- Permalink
- Report to a Moderator
@bendawson wrote:
I am using FOR loop and case structure because i have many different cases in my actual VI where i have to set different ranges of y scale depending upon the case but here i just shared a single case as i have issues regarding x-scale.
Why do you only respond to a minor comment instead of all my points? You still only need to set new properties if they are different to the current settings. If the cases should be different at different iterations, the combo box terminal should not be inside the loop. Are you autoidexing on an array of strings in the full code, for example?
It seems insane to me to create so many markers (and grid lines). It gets ugly pretty fast unless the graph width in pixels is an integer multiple of the number of markers. If you want to mostly be zoomed in, maybe the xmax should be less than the data range, but constantly resetting the limits will not let you operate the scrollbar manually. Seems obvious.
Why don't you take a step back and show us more of your code.
What are the properties of the dynamic data? I guess there are six channels, but you still have not told us how many points are received with each iteration. What is dx? Your chart history is only 1024 points, so after that many points have been received, part (or eventually all) of your data will be outside xmin/xmax as old points are discarded.
12-27-2017 11:11 PM
- Mark as New
- Bookmark
- Subscribe
- Mute
- Subscribe to RSS Feed
- Permalink
- Report to a Moderator
i am not autoidexing on an array of strings and using combo box is not a problem .
let me make this simple and clear so you can provide solution for my problem.
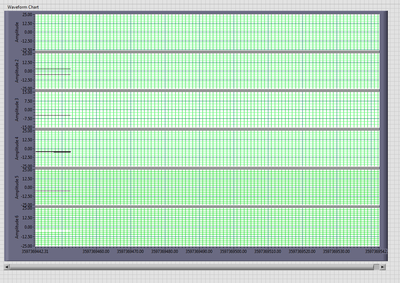
when i set the x scale range as shown in the 1st image but when i run my VI to observe my reading on chart it just randomly changes its value as you can see in second image (all options regarding autoscale in unchecked)
my dynamic data is a dc signal of 3v , so i have no idea about how many points are received with each iteration. and about the dx .
so, this is main problem..
furthermore, if i set x scale range according to my requirement it actually starts to flicker and again changes the value by of x sacle randomly ..
so, how could i actually view my analog signal on my chart within the range of xscale which i set instead of it's being randomly changed.
12-27-2017 11:56 PM
- Mark as New
- Bookmark
- Subscribe
- Mute
- Subscribe to RSS Feed
- Permalink
- Report to a Moderator
@bendawson wrote:
i am not autoidexing on an array of strings.
I never said you do. I was just wondering what the real code looks like.
@bendawson wrote:
... as shown in the 1st image but when i run my VI to observe my reading on chart it just randomly changes its value as you can see in second image (all options regarding autoscale in unchecked)
This thread contains no images. Did you forget to insert them?
@bendawson wrote:
... so i have no idea about how many points are received with each iteration.
It would be easy to find out, so please do. If you would wire a graph instead of a chart, how many points would you see? Obviously, dx is not 1, else you would only see three points.
@bendawson wrote:
so, how could i actually view my analog signal on my chart within the range of xscale which i set instead of it's being randomly changed.
Is the change truly random (different every time) or consistently different? Again, since you have not attached any pictures of (1) what you see and (2) what you expect to see instead we are stabbing in the dark. It is difficult to help if the information is so sparse.
As I said, charts will slide the x-axis once the chart buffer is filled so it is not a good idea to constantly fight it with property nodes. I also don't understand why you set xscale.Rngstart to 2.11, i.e. the same as the max.
How does the chart look like if you don't use any property nodes?
12-28-2017 02:16 AM
- Mark as New
- Bookmark
- Subscribe
- Mute
- Subscribe to RSS Feed
- Permalink
- Report to a Moderator


sorry about images.
now here i am not using any propertynodes i just fix x scale max and x scale min from waveform chart property but still when i run my VI, x scale auto set these random values as shown in image 2 even though i unchecked all autoscaling options.
i understand that charts will slide the x-axis once the chart buffer is filled so, how could i set my x axis display as i want every time ?
what should i do if want to display x axis with the ranges i have mentioned in my 1st post and i don't want this to change randomly?
12-28-2017
12:16 PM
- last edited on
10-21-2025
10:44 AM
by
![]() Content Cleaner
Content Cleaner
- Mark as New
- Bookmark
- Subscribe
- Mute
- Subscribe to RSS Feed
- Permalink
- Report to a Moderator
Obviously, your dynamic data contains an absolute timestamp (# of seconds since Jan 1,1904) and is not compatible with your axis formatting.
You simply need to do a few things:
- Convert the dynamic data to plain data, stripping out all these attributes
- Set dx of the x-axis to something <<1, whatever the correct value is.
- Show more than zero decimal digits for the x-axis.
Since you still have not told us what the dynamic data contains, I assume 6 channels with one point each per update.
Maybe there are lower level function that give you more control over the acquired data from the beginning. Serious LabVIEW programmers don't use express VIs and dynamic data. Dynamic data is way too opaque for debugging your problem. It can contain almost anything and there is no way to tell what's in there. (I cannot look at your express configuration).
12-29-2017 12:53 AM
- Mark as New
- Bookmark
- Subscribe
- Mute
- Subscribe to RSS Feed
- Permalink
- Report to a Moderator
i think we are getting closer to find the solution , as i am working with daqnavi assistant and ploting dynamic data for the first time that's why i am having these problems and you are helping a lot, thanks.
Now, i understand about this absolute timestamp issue so please tell me how can i remove it or convert my dynamic data to plain data and strip these attributes ? so i can set my axis easily..
