- Subscribe to RSS Feed
- Mark Topic as New
- Mark Topic as Read
- Float this Topic for Current User
- Bookmark
- Subscribe
- Mute
- Printer Friendly Page
lower and upper limit on graph - LabVIEW NXG 3.0
Solved!03-21-2019 02:01 PM - last edited on 03-21-2019 04:03 PM by LiliMcDonald
- Mark as New
- Bookmark
- Subscribe
- Mute
- Subscribe to RSS Feed
- Permalink
- Report to a Moderator
Hello
Solved! Go to Solution.
03-28-2019 12:15 PM
- Mark as New
- Bookmark
- Subscribe
- Mute
- Subscribe to RSS Feed
- Permalink
- Report to a Moderator
Hey Granado,
What exaclty do you mean when you said the limits got messy?
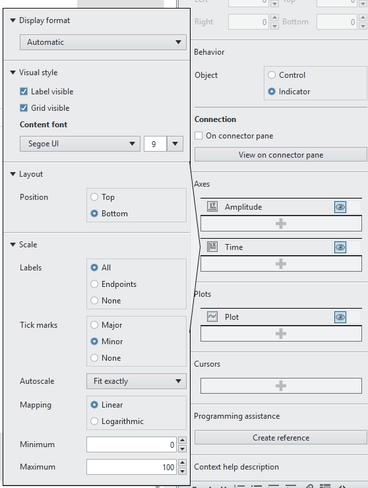
Regarding the X axis, have you checked the axis settings for the graph control in webVIs?
Technical Support Engineer
National Instruments
04-02-2019 08:18 AM
- Mark as New
- Bookmark
- Subscribe
- Mute
- Subscribe to RSS Feed
- Permalink
- Report to a Moderator
I needed to look very closely at the images to understand the problem.
You have set the end time of your Graph to 3:something PM. This corresponds to the right-most tick on the X Axis. Unfortunately, the Label associated with this says 11AM, which should be the label of the tick just to the LEFT of the last one. Correct?
04-02-2019 08:38 AM
- Mark as New
- Bookmark
- Subscribe
- Mute
- Subscribe to RSS Feed
- Permalink
- Report to a Moderator
Hello Intaris
Actually I figured out that I had a problem related on how my LV 2016 reads the data from my sql database.
This issue led my string to timestamp VI to convert my date wrong.
04-02-2019 08:38 AM
- Mark as New
- Bookmark
- Subscribe
- Mute
- Subscribe to RSS Feed
- Permalink
- Report to a Moderator
Hello FloresFe,
Actually I figured out that I had a problem related on how my LV 2016 reads the data from my sql database.
This issue led my string to timestamp VI to convert my date wrong

