- Subscribe to RSS Feed
- Mark Topic as New
- Mark Topic as Read
- Float this Topic for Current User
- Bookmark
- Subscribe
- Mute
- Printer Friendly Page
Why are these two charts different?
04-13-2016 11:53 AM
- Mark as New
- Bookmark
- Subscribe
- Mute
- Subscribe to RSS Feed
- Permalink
- Report to a Moderator
As always making a simple chart in LabVIEW is a huge pain in the you know what.
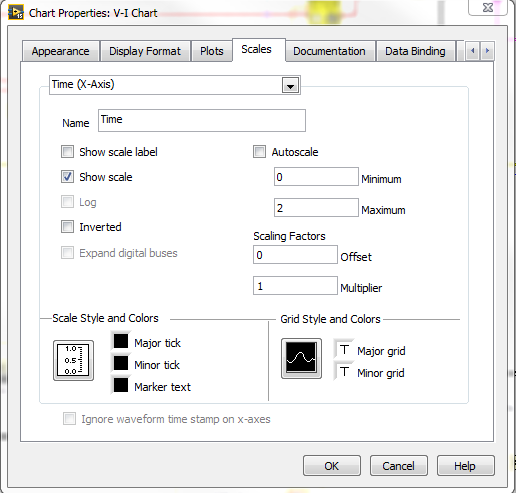
I have two charts with the same properties for the X-Axis. Why is the X-Axis different in the top chart?
=== Engineer Ambiguously ===
========================
04-13-2016 12:11 PM
- Mark as New
- Bookmark
- Subscribe
- Mute
- Subscribe to RSS Feed
- Permalink
- Report to a Moderator
I'm going to channel my inner Bob Schor for a second....
You really need to post your VI or an example VI that shows this behavior to get anything besides guesses on whats going on
04-13-2016 12:19 PM
- Mark as New
- Bookmark
- Subscribe
- Mute
- Subscribe to RSS Feed
- Permalink
- Report to a Moderator
I second the motion. I was going to guess that the second set of data was taken 6 and a half hours after the first, but from the tiny fragment you have shown us, that doesn't seem likely.
Bob Anonymous
04-13-2016 12:20 PM
- Mark as New
- Bookmark
- Subscribe
- Mute
- Subscribe to RSS Feed
- Permalink
- Report to a Moderator
@RTSLVU wrote:I have two charts with the same properties for the X-Axis. Why is the X-Axis different in the top chart?
Yes, we need to see the VI. How's the chart history size? What's the update mode?
I also think that the chart is different in both charts, not just the top one. 😄
I don't understand your 0..2 scale max/min x-range. In absolute time, that would be very long ago over a very short interval. 😉
04-13-2016 12:23 PM
- Mark as New
- Bookmark
- Subscribe
- Mute
- Subscribe to RSS Feed
- Permalink
- Report to a Moderator
Okay so I copied that little bit of code and made a VI to upload.
Now both charts on the new Vi are four and a half hours off on their X-axis time stamp.
They are both wrong but at least they are the same now.
Why is this so difficult?
=== Engineer Ambiguously ===
========================
04-13-2016 12:25 PM - edited 04-13-2016 12:26 PM
- Mark as New
- Bookmark
- Subscribe
- Mute
- Subscribe to RSS Feed
- Permalink
- Report to a Moderator
Turn on the date display. I'll wager it shows that the dates are in 1903 or 1904.
Basically, the date readout on a chart is just an index converted to a time using the standard LabVIEW time stamp format, i.e. 12 midnight on January 1st 1904 GMT, then adjusted for your time zone.
If you add a lot more values to one chart than to the other, maybe it increments more, hence the offset?
Pretty sure you'll need to switch to XY charts with time stamps wired into the X values.
04-13-2016 12:30 PM - edited 04-13-2016 12:35 PM
- Mark as New
- Bookmark
- Subscribe
- Mute
- Subscribe to RSS Feed
- Permalink
- Report to a Moderator
If you also show the date, you'll see that you are around newyear 1904 and the start time depends on your time zone. (it would be midnight at UTC).
If you want the correct absolute time, you need to set t0 at the start of the program.
Try something like this....

04-13-2016 12:37 PM
- Mark as New
- Bookmark
- Subscribe
- Mute
- Subscribe to RSS Feed
- Permalink
- Report to a Moderator
Altenbach,
Even if he does that, it increments the chart 1 second for every point written to it. Unless the data comes in at precisely 1-second intervals, the time readout will still be off.
Basically, using a chart that only takes Y values as an input is insufficient. He needs to move to either an XY graph or a waveform graph.
04-13-2016 12:37 PM
- Mark as New
- Bookmark
- Subscribe
- Mute
- Subscribe to RSS Feed
- Permalink
- Report to a Moderator
@altenbach wrote:If you also show the date, you'll see that you are around newyear 1904 and the start time depends on your time zone. (it would be midnight at UTC).
If you want the correct time, you need to set t0 at the start of the program.
Hmmm you are right, but why did it work right to begin with?
The same program but with only the V-I chart and has been in use for a couple months.
I actually copied the V-I chart and made the Temperature chart out of it so they would be the same, that's when the trouble started.
Set t0? How do I do that?
=== Engineer Ambiguously ===
========================
04-13-2016 12:49 PM
- Mark as New
- Bookmark
- Subscribe
- Mute
- Subscribe to RSS Feed
- Permalink
- Report to a Moderator
I figured it out. Turns out I was setting some properties for the V-I chart in my init state that I forgot to add when I added the Temperature chart.
Doh, sorry.
=== Engineer Ambiguously ===
========================


