- Subscribe to RSS Feed
- Mark Topic as New
- Mark Topic as Read
- Float this Topic for Current User
- Bookmark
- Subscribe
- Mute
- Printer Friendly Page
Waveform peak detector - how to store all the peak locations
04-22-2014 02:12 AM
- Mark as New
- Bookmark
- Subscribe
- Mute
- Subscribe to RSS Feed
- Permalink
- Report to a Moderator
Dea all,
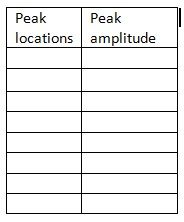
I used waveform peak detector. I need to store the peak location and peak amplitude in two columns. and all the peaks location will appear in the column with real time stamps. How to solve this? Thanks
04-22-2014 03:55 AM
- Mark as New
- Bookmark
- Subscribe
- Mute
- Subscribe to RSS Feed
- Permalink
- Report to a Moderator
I don't know if I understand you well, but I think, that all you need to do is read help for this function
http://zone.ni.com/reference/en-XX/help/371361H-01/lvwave/waveform_peak_detection/
04-22-2014 08:32 PM
- Mark as New
- Bookmark
- Subscribe
- Mute
- Subscribe to RSS Feed
- Permalink
- Report to a Moderator
Hi Adam Trojak,
Thanks for replying me. I am sorry I am quite new to labview so I may need more guide on this. Actually the waveform peak detector works well in my application. But the result is a bit diffrent from the one I want. I used DAQ to get my signal which the sample to rate is 3K, rate is 1K. So that when I read my signal and pass the function, the location results is not real time, they displayed within 3 second. View the picture I attached, in 3 second, there are 4 peaks, displaying the locations as 39.3281, 862.318, 1670.41, 2457.16. I need the next peaks after the 4 peaks should be at around 3200, but it displays in 3 second again. I hope you understand my problem.
04-22-2014 10:13 PM
- Mark as New
- Bookmark
- Subscribe
- Mute
- Subscribe to RSS Feed
- Permalink
- Report to a Moderator
You need to post your VI. Are you saying you are analyzing the same data again? Or that the next snapshot of data is starting over at zero and you don't want it to?
04-22-2014 11:02 PM
- Mark as New
- Bookmark
- Subscribe
- Mute
- Subscribe to RSS Feed
- Permalink
- Report to a Moderator
Hi RavensFan,
For example I used the same data continuously, I expect the next peaks display to be at 3039.3281, 3862.318,4670.41 and 5457.16. But the actual results are still at 39.3281, 862.318, 1670.41, 2457.16. I wonder to know if it is related to my data of sampling? How to solve this? Thank you.
04-22-2014 11:03 PM
- Mark as New
- Bookmark
- Subscribe
- Mute
- Subscribe to RSS Feed
- Permalink
- Report to a Moderator
You need to post your VI.
I don't know how you are sampling to be able to answer that question.
04-22-2014 11:19 PM
- Mark as New
- Bookmark
- Subscribe
- Mute
- Subscribe to RSS Feed
- Permalink
- Report to a Moderator
Please help me to take a look. Thanks
04-22-2014 11:43 PM
- Mark as New
- Bookmark
- Subscribe
- Mute
- Subscribe to RSS Feed
- Permalink
- Report to a Moderator
You're losing your timing information you have in teh waveform datatype when you convert it from a waveform to a double array through that Express VI. Then you make your X values the hard coded 0 to 2999 by way of that For Loop which are the same values every iteration.
What you need to do is use the ramp function instead of that For Loop. Then you can store your final ramp value in a shift register, and use that as the start point for the next iteration of the while loop.
I'm not sure all what you are doing here. You are reading the same file over and over in a loop. Is that file ever changing? If not, why do you even have a while loop?
Since youre ECG Peak Threshold is never used as a control, you should turn that into an indicator and use that terminal instead of the local variable.
04-23-2014 01:40 AM
- Mark as New
- Bookmark
- Subscribe
- Mute
- Subscribe to RSS Feed
- Permalink
- Report to a Moderator
Hi RavensFan,
I am really new for labview and I found out labview is hard to check where you go wrong coz you can not see the values in the parameters even you can set breakpoint. I appreciate if you could help me to do some modification on my current VI. I attach the data for you to try out. I have a 4 to 5 mins signal.
04-23-2014 08:44 AM
- Mark as New
- Bookmark
- Subscribe
- Mute
- Subscribe to RSS Feed
- Permalink
- Report to a Moderator
HIghlight execution slows down the execution of the code and lets you see all the values going down the wires.
Putting probes on wires will show you the values in the wire and when it last executed.
Putting extra indicators into your block diagram can show you on the front panel the values in wires you wouldn't normally have looked at.


