- Subscribe to RSS Feed
- Mark Topic as New
- Mark Topic as Read
- Float this Topic for Current User
- Bookmark
- Subscribe
- Mute
- Printer Friendly Page
Waveform low frequency component's power
06-22-2016 08:56 AM
- Mark as New
- Bookmark
- Subscribe
- Mute
- Subscribe to RSS Feed
- Permalink
- Report to a Moderator
Hi everyone,
Can you please help me ?
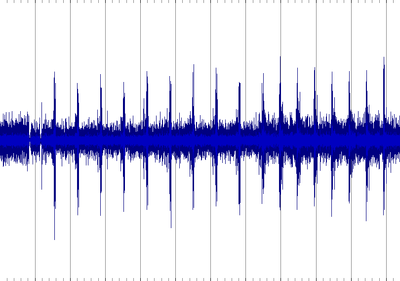
I have a wav file (enclosed) that contains a recorded sound of an industrial motor. Here is it's waveform in time domain. the signal has three parts:
- The first div: there is no peaks
- From div #2 to #6: There are peaks at 3Hz
- From div #7 to the end: There are peaks at 4Hz
I have simailar wav files with different peaks amplitudes. There is some file that have huge peaks like this one and others with smaller values. I want to know how to do to distinguish between them. I need to analyse the waveform and say if it contains huge peaks or not. I want to use spectrum analysis. Can I use the power of frequencies 3Hz and 4Hz.

06-22-2016 11:01 AM
- Mark as New
- Bookmark
- Subscribe
- Mute
- Subscribe to RSS Feed
- Permalink
- Report to a Moderator
I wish I was an expert in that area ( I am NOT) but the Sound ANd Vibration Toolkit has a lot of functions built-in.
I will wathc this thread to learn from those that know more about this topic.
Ben
06-22-2016 09:16 PM
- Mark as New
- Bookmark
- Subscribe
- Mute
- Subscribe to RSS Feed
- Permalink
- Report to a Moderator
It may not be very simple or straightforward. With only one file it is impossible to know how things vary among the files.
I looked at the spectrum of the signal you posted. It has strong peaks at 292, 438, 585, 731, 120, and 36.666 Hz. There is a somewhat weaker peak at 146 Hz. The first four frequencies appear to be harmonically related to 146 Hz. Does this correlate with the rotational speed? The peaks at 2.98 and 3.86 Hz are about 1/20 the amplitude of the six strong peaks. There is also broad band noise from about 1000 to 3000 Hz which is about 10 times larger than the 3 and 4 Hz peaks. There are peaks at 6 and 7 Hz which are stronger than the 3 and 4 Hz peaks.
I then split the data set into three time segments according to your classification as no peaks, 3 Hz, and 4 Hz. I looked at the spectra of each of those segments. Some frequencies appear in all and others in only one or two of the spectra. For example 120 Hz appears in all of them. Is this your power line frequency second harmonic? The 3 Hz spikes signal has strong peaks at ~150, 300, and 450 Hz. The 4 Hz spikes signal has strong peaks at ~100, 200 , and 400 Hz. Becase the data sets are shorter (and different lengths) the frequency resoluton at the low frequency end makes the interpretation of that data belwo 10 Hz difficult.
My recommendation: Those low frequency peaks will not be reliable when measured in the frequency domain. The ratio of peak value to RMS value for the data segments is much larger for the sgements with spikes. So that might be a useful test. The code to make that calculation is not in the VI attached.
This is a situation where you really need to have some understanding of the physics behind the measurements. What makes the various sounds? How do they relate to the chracteristic of the motor you want to determine? Do you have an independent measurement of the motor speed (such as from an encoder)? That could be very helpful in determining the frequencies you want to check.
Note: When I save this VI for a previous version I got a warning about a possible broken VI or missing input. It referred to the Get Waveform Subset.vi.
It is helpful if you mention the version of LV you are using. If you post a VI the version can be determined from the VI itself.
Lynn
06-23-2016 06:58 AM
- Mark as New
- Bookmark
- Subscribe
- Mute
- Subscribe to RSS Feed
- Permalink
- Report to a Moderator
Ben:
Thank you for replying. Unfortunately I don't have this toolkit.
John
Thank you for your reply. I really appreciate it.
Here are some response to your questions:
- The rotational speed of my motor is 3 Revolution per second in the second phase of "3hz". And 4 Revolution per second in the phase of "4Hz". Each peak appears when the motor do a rotation. It s a very slow stepper motor.
- My motor is power by a stepper driver. the frequency of steps is 150Hz in "3Hz" phase and 200Hz in "4hz" phase.
- The sound is generated by a mechanical problem in the rotor of the motor. This can appears when the rotor non aligned with the stator. We don't have any encoder to have a the feedback the rotational speed. I use an accelerometer to get the waveform for each motor.
- I am using LV 2014
Please find enclosed a new version of "Motor spectrum.vi". I added some code to get the envelope of the waveform using hilbert transform. Also, I added spectrum of the envelope. So I can meaningful values of the power of low frequency 3 hz and 4 Hz. Is this can help ?
I enclosed also two other recordings: one is for a good motor and another one for a noisy motor.
