- Subscribe to RSS Feed
- Mark Topic as New
- Mark Topic as Read
- Float this Topic for Current User
- Bookmark
- Subscribe
- Mute
- Printer Friendly Page
Wait Until Next Millisecond Taking longer than it should
10-23-2019 12:43 PM
- Mark as New
- Bookmark
- Subscribe
- Mute
- Subscribe to RSS Feed
- Permalink
- Report to a Moderator
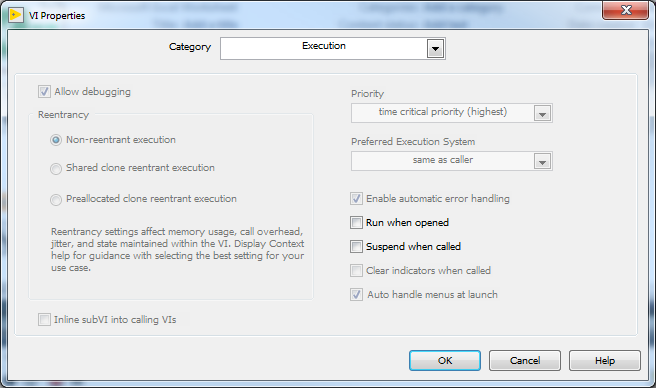
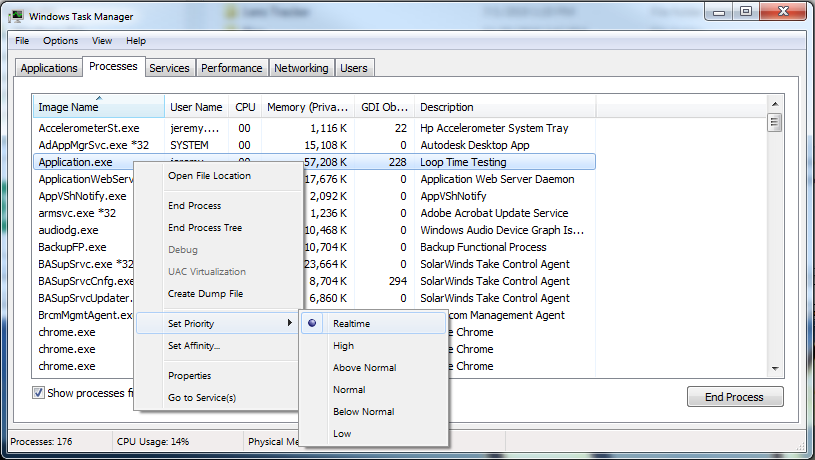
I have tried every combination of LV execution priority and windows priority as well, but over a 24 hr period, they are all the same result. I understand that 100ms is not actually 100ms, but how is 6200ms acceptable, even 200ms would be terrible?
10-23-2019 01:16 PM
- Mark as New
- Bookmark
- Subscribe
- Mute
- Subscribe to RSS Feed
- Permalink
- Report to a Moderator
Just guessing here:
You are using High Resolution Relative Seconds which returns the relative current time in seconds.
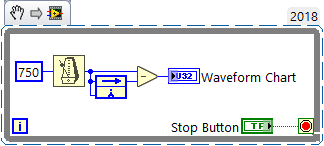
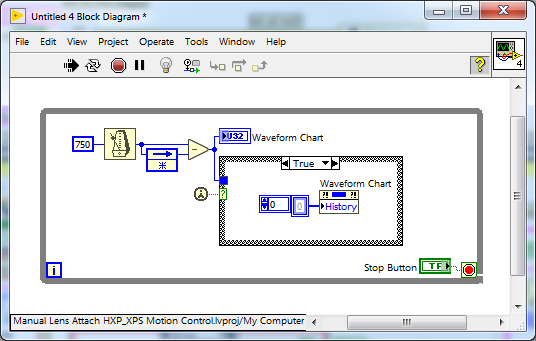
Could your computer be updating the time from a server once every 24 hours? Try something simpler like below and see what you get. Your code is simple but still convoluted.
mcduff
10-23-2019 01:20 PM
- Mark as New
- Bookmark
- Subscribe
- Mute
- Subscribe to RSS Feed
- Permalink
- Report to a Moderator
Hi evapjep,
@evapjep wrote:
I have tried every combination of LV execution priority and windows priority as well, but over a 24 hr period, they are all the same result. I understand that 100ms is not actually 100ms, but how is 6200ms acceptable, even 200ms would be terrible?
So you claim that (maybe) single event of 6.2s loop iteration time?
When you are worried about loop time investigation you should not just check the max time, but also create a histogram of the loop times and judge from that!
Windows will interfere your process even on "Realtime" setting - having a 6.2s "event" can happen on Windows. When you need accurate timings you should use a FPGA instead!
Btw. there is a MinMax function in the comparison palette!
10-23-2019 01:26 PM
- Mark as New
- Bookmark
- Subscribe
- Mute
- Subscribe to RSS Feed
- Permalink
- Report to a Moderator
10-23-2019 01:31 PM
- Mark as New
- Bookmark
- Subscribe
- Mute
- Subscribe to RSS Feed
- Permalink
- Report to a Moderator
In my actual loop there is no ms monitor, I just made that vi to confirm it was the loop slowing down, does the same with the low res tick or get time. My issue started with a loop with a wait and a DAQmx digital write and a not Boolean wired to a shift register to toggle each iteration, very simple.
with your suggestion... and only a little time... already see 100ms over (still would be ok, but you see the issue now?)
10-23-2019 01:45 PM
- Mark as New
- Bookmark
- Subscribe
- Mute
- Subscribe to RSS Feed
- Permalink
- Report to a Moderator
@evapjep wrote:
In my actual loop there is no ms monitor, I just made that vi to confirm it was the loop slowing down, does the same with the low res tick or get time. My issue started with a loop with a wait and a DAQmx digital write and a not Boolean wired to a shift register to toggle each iteration, very simple.
with your suggestion... and only a little time... already see 100ms over (still would be ok, but you see the issue now?)
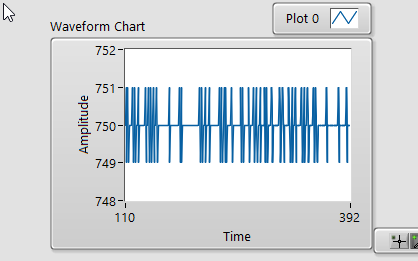
This is what I see over ~750 seconds. (Suggestion get the property node out of your loop, it may cause all of your loop to run in the UI thread, which may cause "big" delays.)
mcduff
10-23-2019 01:56 PM
- Mark as New
- Bookmark
- Subscribe
- Mute
- Subscribe to RSS Feed
- Permalink
- Report to a Moderator
Not the property node either, was just clearing the chart the first time to remove the big time on first run. Again, this is a recent issue, I had no problem until maybe August 2019, this is LV2017 64-bit on a Win7 64-bit i7 machine (and a mix of i5/i7,Win7,Win10 running the .exe's).
I cannot believe this is isolated to just my PCs, I run .exe's on about 17 PC's and slowly they are all seeing this issue and where once stable tests to 27 days or more (also seems to be where windows becomes unstable 27-33days uptime), now they don't run over 3 hours without a glitch and interlock dropout. I can change the hardware to allow 10 seconds, but there must be a fix for this out there??
10-23-2019 02:20 PM
- Mark as New
- Bookmark
- Subscribe
- Mute
- Subscribe to RSS Feed
- Permalink
- Report to a Moderator
Sorry not sure what to suggest, so far I do not see an issue like that on my PC.
Some suggestions no idea if work or true
- Not sure where the ms timer comes from. Is there something on your computer that could be interrupting it?
- Power saving modes on a laptop dynamically spinning up/down CPUs that aren't needed or need to be used.
- Frequency switching on CPU. Not likely, my desktop is doing that and doesn't seem to be a problem.
- Background processes, such as AV, company scans, etc.
Sorry I cannot help more.
You can try running the program after you boot up in Safe Mode, that usually turns off all unnecessary services.
mcduff
10-23-2019 02:23 PM
- Mark as New
- Bookmark
- Subscribe
- Mute
- Subscribe to RSS Feed
- Permalink
- Report to a Moderator
A 100 or 150 milliseconds is a huge difference from 6 seconds. And you can see that every time it happened, the next iteration was shorter to get it back on track.
So run this until you see something that is in the 6000 range on that chart and get back to us.
What has changed on all your PC's since August 2019? Did your IT department do something with virus scanners or anything like that?
10-23-2019 02:26 PM
- Mark as New
- Bookmark
- Subscribe
- Mute
- Subscribe to RSS Feed
- Permalink
- Report to a Moderator
Things I have seen "halt" my programs: virus scan, Windows update, network traffic, writing "large" files to disk, opening "large" files, IT tracking software, and Windows just being Windows. I have no doubt this is just your PCs. If these are on a company network, then your issue is likely some software your IT department recently pushed onto everything. This is just one of the reasons I refuse to put a test system on a company network (trying to push for a private network that I can manage).
Otherwise, how consistent do you need your loop rates to be? The more you say, the more convinced I am that you should be running on an RT OS or put timing critical parts in an FPGA board.
There are only two ways to tell somebody thanks: Kudos and Marked Solutions
Unofficial Forum Rules and Guidelines
"Not that we are sufficient in ourselves to claim anything as coming from us, but our sufficiency is from God" - 2 Corinthians 3:5
