- Subscribe to RSS Feed
- Mark Topic as New
- Mark Topic as Read
- Float this Topic for Current User
- Bookmark
- Subscribe
- Mute
- Printer Friendly Page
Title and Peak
02-09-2012 08:48 PM
- Mark as New
- Bookmark
- Subscribe
- Mute
- Subscribe to RSS Feed
- Permalink
- Report to a Moderator
Hi guys I'm reaching my deadline! So heres the problem.
Is there any way I can get my waveform peaks other than how I did? Preferably I would want it to be like a prompt. For eg, when I wish to know the the peak value for Plot A, I click on something and a pop-up display shows its peak value.
Secondly, is there any way that my waveform graph label name can be 'linked' to the filename of the text file I'm importing? For eg, the text filename is int_ana_111201.txt. So everytime when I run my vi, the graph label would be like, "Reading of int_ana_11201"
Hope I made sense here!
Note: I wish to have the vi look as much as the way it is currently. Because I've shown my earlier progress to my sup. But any help would be greatly appreciated!
By the way, in case if one tends to wonder, most of the time, I only wish to read Poly_M_Tem and Thin_M_Tem
Thanks in advance!
02-09-2012 09:00 PM - edited 02-09-2012 09:05 PM
- Mark as New
- Bookmark
- Subscribe
- Mute
- Subscribe to RSS Feed
- Permalink
- Report to a Moderator
I'll tackle the easier question first.
For the graph, hide the label and show the caption. Then use the strip path function to get the file name and feed that to the caption.text property node for the graph.
For the Peak prompts, it all depends on what exactly you want to do. What would you like to click on? Right now your VI is a single run VI. It runs, it finishes, it doesn't wait around to do anything else. If you added a while loop, you could wait on things to happen. Use an event structure that wait for something to happen, then it can pop up the appropriate message.

02-09-2012 09:35 PM
- Mark as New
- Bookmark
- Subscribe
- Mute
- Subscribe to RSS Feed
- Permalink
- Report to a Moderator
Thanks for the response! The strip path worked perfectly!
Regarding the peak, scrap the prompt idea hahahah. How about I just want to display the peak values of the plots. But currently I only have the x value. I also need the y value.
02-09-2012 09:53 PM
- Mark as New
- Bookmark
- Subscribe
- Mute
- Subscribe to RSS Feed
- Permalink
- Report to a Moderator
Do you mean you actually have the Y value and are looking for the X? Since the peak value is the maximum value of your Y arrays.
There is the search 1-D array function that should give you the X value for the corresponding Y. Of course that X is an index, but doing some math with your dT value should give you the actual time value on the X axis.
02-09-2012 10:50 PM
- Mark as New
- Bookmark
- Subscribe
- Mute
- Subscribe to RSS Feed
- Permalink
- Report to a Moderator
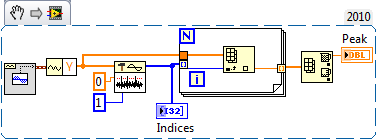
I could not able to open your vi, i have LabVIEW 2010.
Try using Threshold Detector under signal operation in signal processing.
If you give threshold as 0 and width as 1. You will get list of indices of peaks,
from that use index array to find values and use Array max function.
May be you can try it out with this option if it fits for you.

