From Friday, April 19th (11:00 PM CDT) through Saturday, April 20th (2:00 PM CDT), 2024, ni.com will undergo system upgrades that may result in temporary service interruption.
We appreciate your patience as we improve our online experience.
From Friday, April 19th (11:00 PM CDT) through Saturday, April 20th (2:00 PM CDT), 2024, ni.com will undergo system upgrades that may result in temporary service interruption.
We appreciate your patience as we improve our online experience.
05-06-2011 01:55 PM
5/26/2011 Edit: Probes updated to have consistent context menu name and various UI updates for the double probe that were missed.
___________________________________________
In the same vein that led to me writing the timing analysis probes, I have a simple question.
How often do you find yourself creating this code off some nice, innocent array, somewhere in your code?
If you're like I was, you do it alot.
Let's say it takes 2 minutes to drop this code (and organize it, because of my OCD). Another minute to get the iteration graph scaled in a useful way with plot points instead of lines, etc.
I WANT MY 3 MINUTES BACK.
How about this:
1.

2.
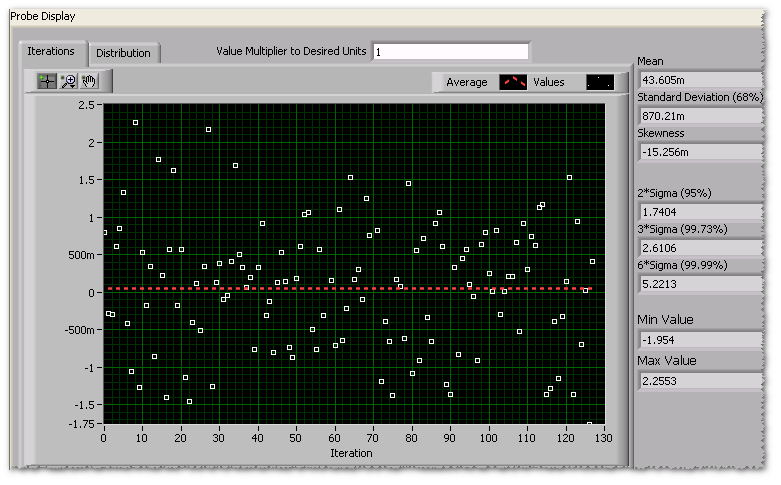
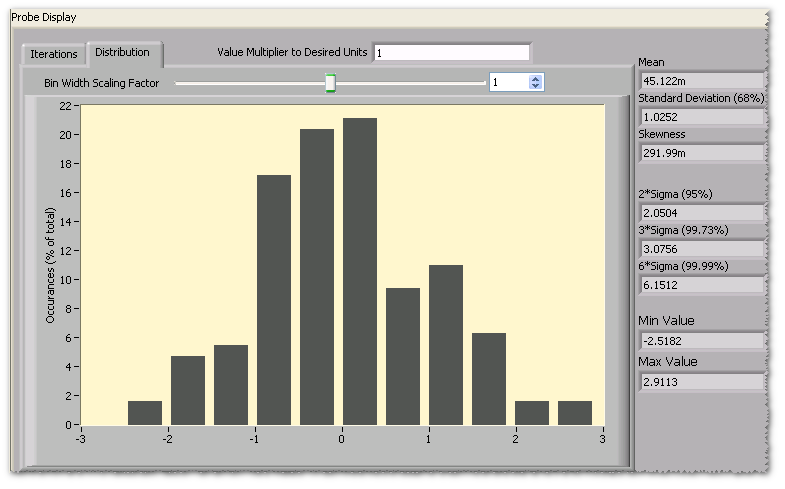
Zero configuration (required) and you get some very decent preliminary statistical analysis on your data set.
In about 2 seconds.
WIN.
If that's all you need to know and you want it, go ahead and download it. If you're thinking "That's trivial, I don't need that or I'll just make my own", keep reading.
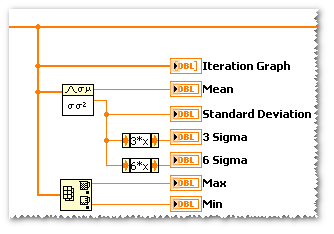
Included are 10 identical probes for almost every 1D numerical array representation (Single, Double, Unsigned and Signed 8/16/32/64 bit Integers).
The key feature for these probes is that they aim to require no configuration to give a good visual analysis of your data set, regardless of how normal the distribution is. They do this by:
Yes, in a different world I would have more time to make this an X control that had dynamic interface and a sexy look and feel. No, these aren't perfect and dont' scale flawlessly for every data set out there. But we use them all the time and just find them too useful to not share them before they are perfect.
Check back every once in a while to see if there is a new version (edit blurb will be at top of post for new versions). If you get data sets that make them barf, please post them by saving the data set as the default value for an array in a VI!
Attached are a set of LabVIEW probes (compiled for 2009 and later) that can be used to probe arrays to give you a quick but useful statistical analysis of the data in that array.
Downalod, unzip and drop them in your LV Probes directory (usually My Documents\LabVIEW Data\Probes) to get started probing.
Evan Prothro
RF Systems Engineer | NI
12-03-2011 05:25 AM
nice idea!
Your timing probes are even more useful. Should've been in LabVIEW natively.
Gerrit van Donk, the Netherlands
