- Subscribe to RSS Feed
- Mark Topic as New
- Mark Topic as Read
- Float this Topic for Current User
- Bookmark
- Subscribe
- Mute
- Printer Friendly Page
Slow and laggy Front Panel selection at edit time
Solved!10-22-2018 09:42 PM
- Mark as New
- Bookmark
- Subscribe
- Mute
- Subscribe to RSS Feed
- Permalink
- Report to a Moderator
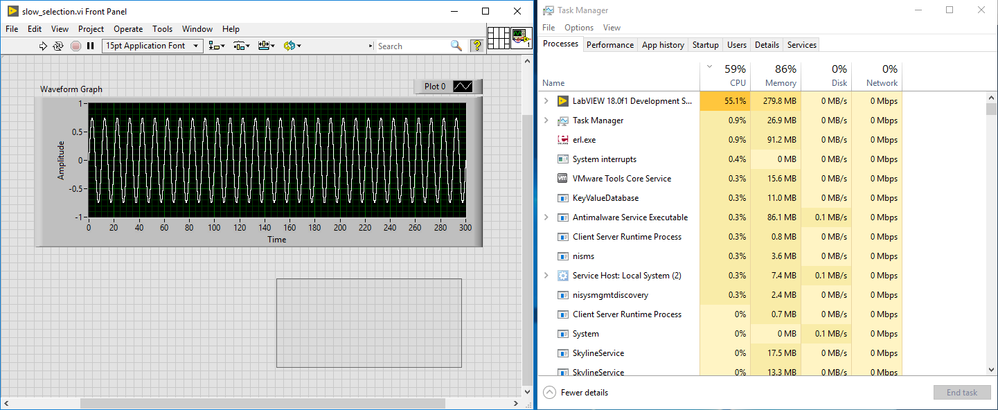
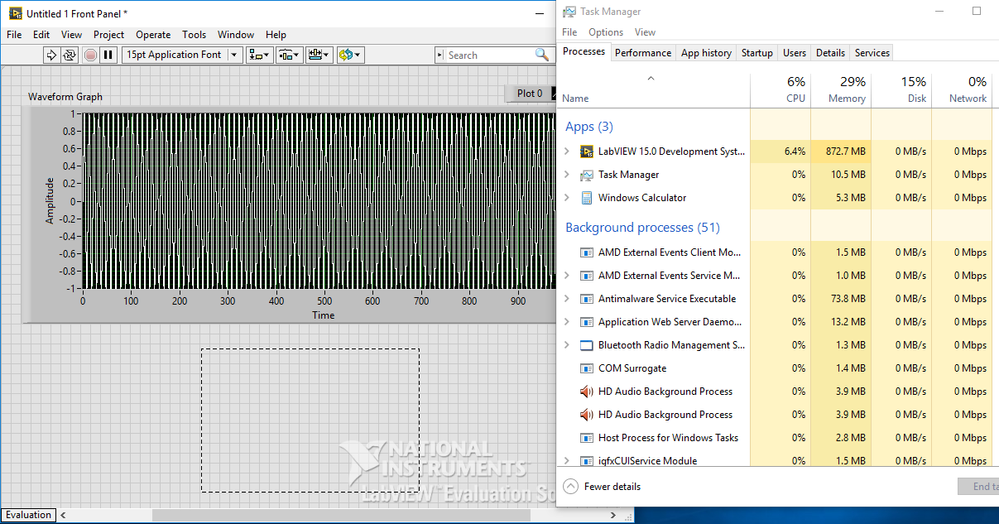
Very simple one. Create a Waveform Graph, fill it with a million points. Now click and drag on the front panel to select something, and wiggle the mouse around a bit. The selection update is very laggy, and LabVIEW maxes out a CPU core. Resizing the window has the same effect.
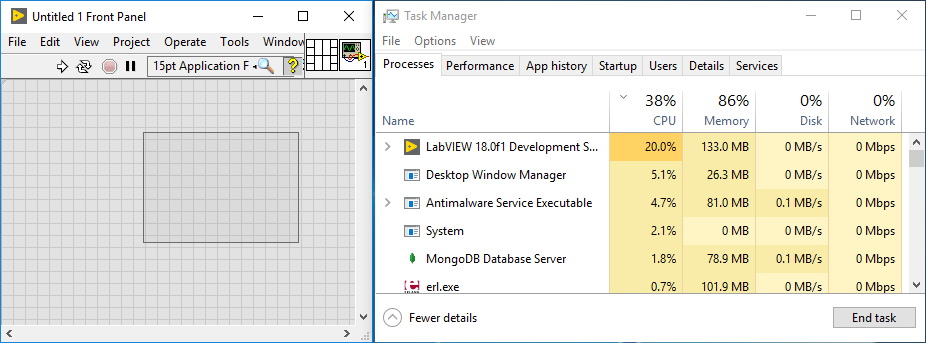
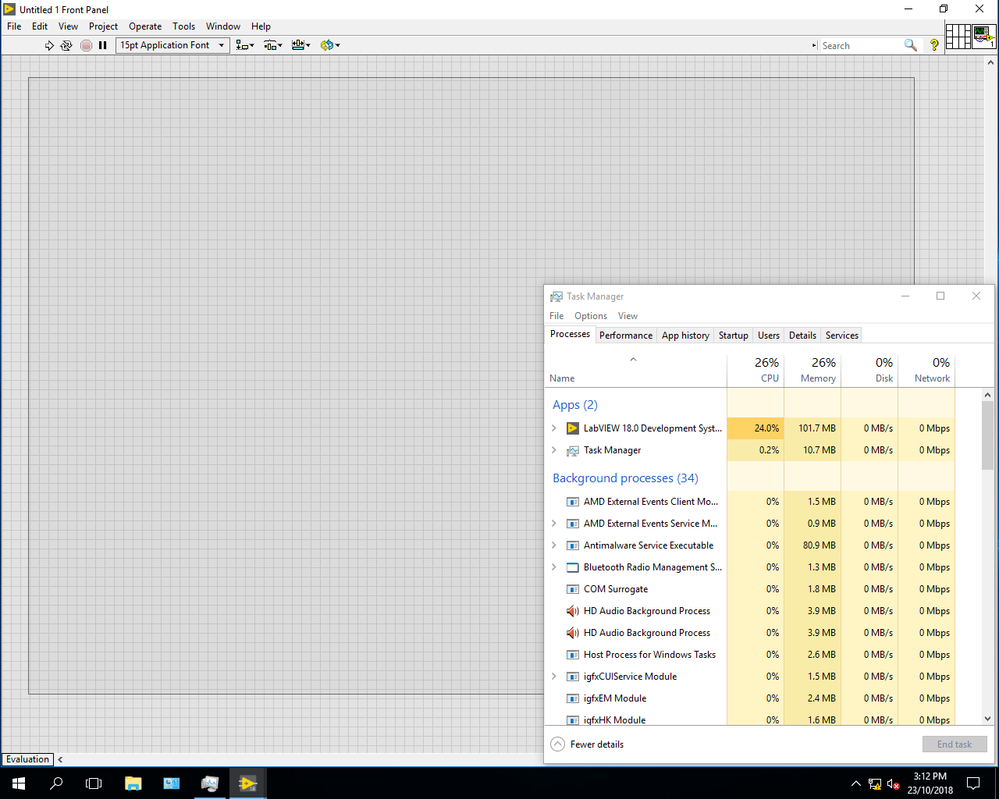
Even just clicking and dragging on a completely empty front panel has the CPU jumping into the double digits (~30% in my VM).
Tested in LV2018 on Win10, and in LV2016 on Win7. Issue not found in LabVIEW 8.5 (the only other version I had to hand), where Task Manager shows LabVIEW using 0% CPU. I suspect it was introduced in LV2016 along with all of the other live dragging and live updating features. My best guess is the semi-transparent selection box, and LabVIEW needing to iterate through every front panel item, work out what object pixels fall within the selection region, then draw the semi transparent overlay. Repeat for every single mouse move event.
Thankfully there are labview.ini keys to disable these features. Is there a secret ini key to bypass this issue too?
Unless otherwise stated, all code snippets and examples provided
by me are "as is", and are free to use and modify without attribution.
Solved! Go to Solution.
10-22-2018 10:17 PM
- Mark as New
- Bookmark
- Subscribe
- Mute
- Subscribe to RSS Feed
- Permalink
- Report to a Moderator
The solution is simple. Don't pretend that you are plotting a million points (because you aren't). You are at most putting a couple hundred points on the screen with LV decimating the blazes out of your data to get it to fit - that is what is taking all the time...
Mike...
Certified Professional Instructor
Certified LabVIEW Architect
LabVIEW Champion
"... after all, He's not a tame lion..."
For help with grief and grieving.
10-22-2018 10:25 PM - edited 10-22-2018 10:27 PM
- Mark as New
- Bookmark
- Subscribe
- Mute
- Subscribe to RSS Feed
- Permalink
- Report to a Moderator
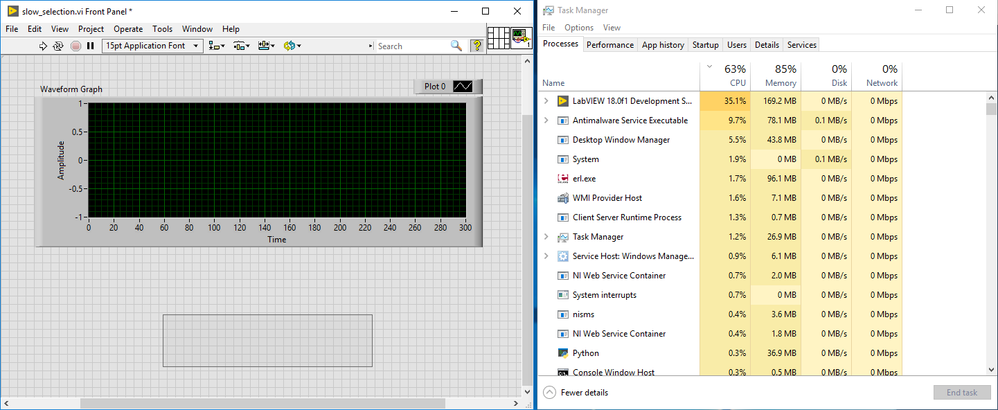
No data. 35% CPU.
In any case this is edit time. I'm not pushing a million points to the graph in a loop. The data is static.
Edit: And this wasn't an issue in older versions of LabVIEW.
Unless otherwise stated, all code snippets and examples provided
by me are "as is", and are free to use and modify without attribution.
10-23-2018 01:01 AM
- Mark as New
- Bookmark
- Subscribe
- Mute
- Subscribe to RSS Feed
- Permalink
- Report to a Moderator
10-23-2018 01:27 AM
- Mark as New
- Bookmark
- Subscribe
- Mute
- Subscribe to RSS Feed
- Permalink
- Report to a Moderator
With a new blank VI it hovers around ~15%, but can get as high as 20%.
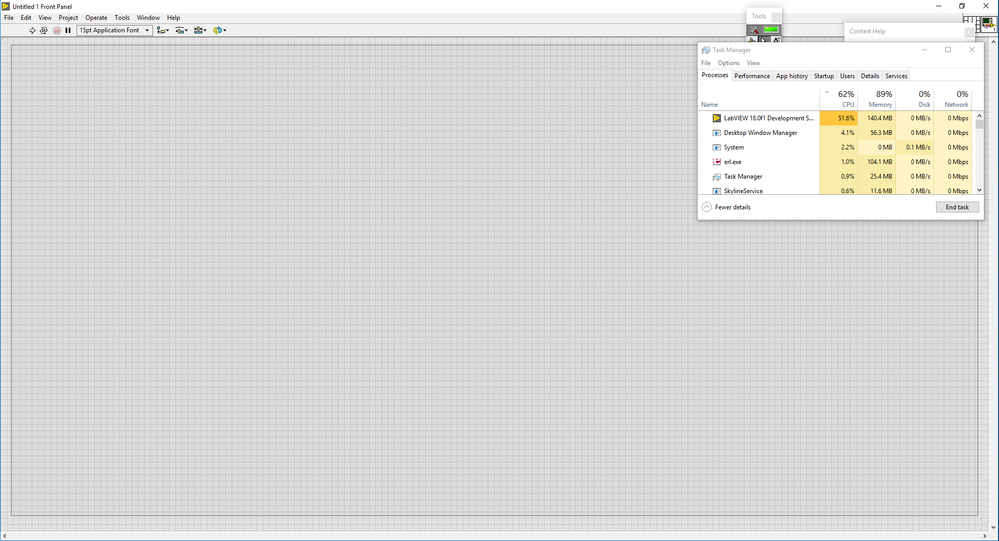
Though if I make the front panel much larger and perform a larger selection, LabVIEW easily hits 50% CPU.
Unless otherwise stated, all code snippets and examples provided
by me are "as is", and are free to use and modify without attribution.
10-23-2018 01:38 AM
- Mark as New
- Bookmark
- Subscribe
- Mute
- Subscribe to RSS Feed
- Permalink
- Report to a Moderator
10-23-2018 03:05 AM
- Mark as New
- Bookmark
- Subscribe
- Mute
- Subscribe to RSS Feed
- Permalink
- Report to a Moderator
Just tested on a spare Win 10 machine (quad core i5) with LV2018 and the CPU is around 20-25%.
I then uninstalled LV2018, and installed LV2015 (the last version before LV2016 began the live wiring changes and semi-transparent selection box change). The CPU is around 2-3%.
Even with a 50 million point waveform in a Waveform Graph, the CPU doesn't reach double digits.
Is there an equivalent labview.ini key to LiveDrag to disable the new selection logic?
Unless otherwise stated, all code snippets and examples provided
by me are "as is", and are free to use and modify without attribution.
10-23-2018 03:15 AM
- Mark as New
- Bookmark
- Subscribe
- Mute
- Subscribe to RSS Feed
- Permalink
- Report to a Moderator
I just tried LiveSelection=False in labview.ini, and that's done the trick. No more laggy semi-transparent selection, and single digit CPU usage. It's so much more responsive now.
Unless otherwise stated, all code snippets and examples provided
by me are "as is", and are free to use and modify without attribution.
09-11-2020 04:56 PM
- Mark as New
- Bookmark
- Subscribe
- Mute
- Subscribe to RSS Feed
- Permalink
- Report to a Moderator
Thanks - solved problem on my new Macbook Pro 16" running LV2020 in bootcamp. Lag was pretty bad, making it hard to align things. Thought that bootcamp might have been the problem, but did not make sense as LV with Apple hardware in bootcamp has been otherwise very speedy. Just added "LiveSelection=False" to the end of "C:\Program Files (x86)\National Instruments\LabVIEW 2020\LabVIEW.ini". Dragging front panel objects at design time is once again as it should be!
09-11-2020 05:16 PM
- Mark as New
- Bookmark
- Subscribe
- Mute
- Subscribe to RSS Feed
- Permalink
- Report to a Moderator
May have spoken too soon - editing was responsive right after re-starting LV, but after my huge ECG plot loaded, then went back to editing, everything was slow again. I cleared the XY graph plots from right-click menu on the plot, and UI editing was once again snappy - seems that LiveSelection=False did not really solve the issue for me concerning large amounts of data left over in an XY graph while editing in-between runs of the VI.
