- Subscribe to RSS Feed
- Mark Topic as New
- Mark Topic as Read
- Float this Topic for Current User
- Bookmark
- Subscribe
- Mute
- Printer Friendly Page
Remove Plots from Chart/Graphs
05-21-2008 12:51 PM - edited 05-21-2008 12:52 PM
- Mark as New
- Bookmark
- Subscribe
- Mute
- Subscribe to RSS Feed
- Permalink
- Report to a Moderator
Thanks!
Message Edited by Derek Price on 05-21-2008 01:52 PM
05-21-2008 01:41 PM
- Mark as New
- Bookmark
- Subscribe
- Mute
- Subscribe to RSS Feed
- Permalink
- Report to a Moderator
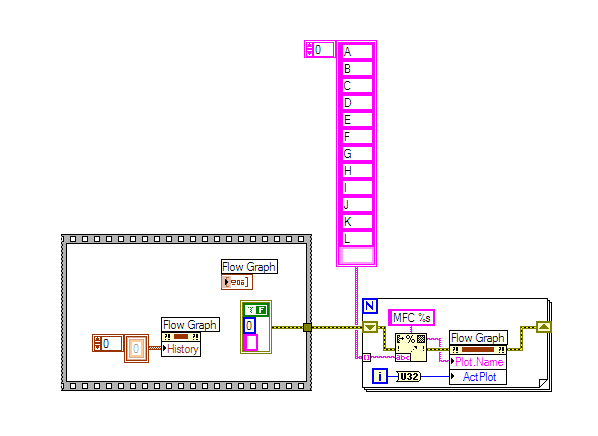
The chart/graphs automatically resize the plots based on the input datatype and size of array (if generating multiple plots).
05-21-2008 02:12 PM - edited 05-21-2008 02:12 PM
- Mark as New
- Bookmark
- Subscribe
- Mute
- Subscribe to RSS Feed
- Permalink
- Report to a Moderator
Any ideas?
Message Edited by Derek Price on 05-21-2008 03:12 PM
Message Edited by Derek Price on 05-21-2008 03:12 PM
05-21-2008 02:22 PM
- Mark as New
- Bookmark
- Subscribe
- Mute
- Subscribe to RSS Feed
- Permalink
- Report to a Moderator
05-21-2008 02:30 PM
- Mark as New
- Bookmark
- Subscribe
- Mute
- Subscribe to RSS Feed
- Permalink
- Report to a Moderator
Thanks,
Derek
05-20-2010 10:26 AM
- Mark as New
- Bookmark
- Subscribe
- Mute
- Subscribe to RSS Feed
- Permalink
- Report to a Moderator
05-20-2010 10:49 AM
- Mark as New
- Bookmark
- Subscribe
- Mute
- Subscribe to RSS Feed
- Permalink
- Report to a Moderator
05-20-2010 11:10 AM
- Mark as New
- Bookmark
- Subscribe
- Mute
- Subscribe to RSS Feed
- Permalink
- Report to a Moderator
Ok I tested that, it does work, resizing the cluster from 3 to 2. But not from 2 to 1. I can't get it to only have 1 plot. If there's a way to change that from the chart's front panel properties, that would be ok too; where is that option though?
05-20-2010 11:37 AM
- Mark as New
- Bookmark
- Subscribe
- Mute
- Subscribe to RSS Feed
- Permalink
- Report to a Moderator
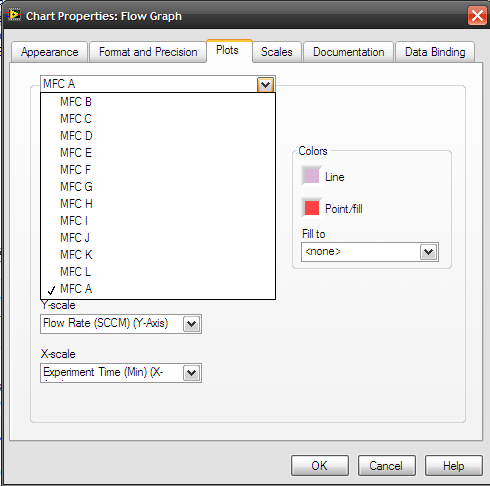
Go to the front pannel. Right click and select properties and use the apperance tab. You will see the number of active plots.
I have one with 5 channels and just tried it. It seems to work with no problem, though it does not affect the legend display.
05-20-2010 11:38 AM
- Mark as New
- Bookmark
- Subscribe
- Mute
- Subscribe to RSS Feed
- Permalink
- Report to a Moderator
