From Friday, April 19th (11:00 PM CDT) through Saturday, April 20th (2:00 PM CDT), 2024, ni.com will undergo system upgrades that may result in temporary service interruption.

We appreciate your patience as we improve our online experience.

LabVIEW

cancel
Showing results for 
Search instead for 
Did you mean: 

Plotting all acquired data

I am acquiring 100 samples at the rate of 5000 samples / sec, for two analog channels.
 
I am using a hardware timing source so that a Timed loop fires once every (100/5000 = 0.02 sec) and the DAQMX Read VI is inside this Timed Loop.
 
I have just shown the reading and plotting part alone in the enclosed Sub-VI.
 
If you look at the VI, you will notice that though I am acquiring 100 samples per channel, I am only using one sample per channel due to the second indexing that has to be done prior to feeding the same to the Waveform Chart. I tried avoiding the second indexing and directly built the signal with the outputs of the First Indexing and the chart went crazy.
 
I need to know how to send all the 100 samples / ch that I am acquiring to the Wave Form chart. ( I am constrained to use only the chart and cannot use the graph as the plot needs to be scrolled back etc )
 
Thanks.
Raghunathan
LabVIEW to Automate Hydraulic Test rigs.
0 Kudos
Message 1 of 6
(2,365 Views)
Hi Raghunathan,

what about this:

I replaced your DAQmx part with two for loops to play with... I think the "transpose" will solve your problems with charts "going crazy". (You should really learn to describe your problems betterSmiley Wink)

Well, is it really neccessary to store 10000 samples/s in a chart?
You neither can show 10000 points in the chart (without overlapping/averaging) nor is it good (in terms of memory usage) to use a chart to "store" big amounts of data (10000 samples/s will be ~80kb/s, 12s ~= 1MB). The calculation is just for the chart - you will most likely create other copies of that data in memory...


Message Edited by GerdW on 07-16-2008 03:57 PM
Best regards,
GerdW


using LV2016/2019/2021 on Win10/11+cRIO, TestStand2016/2019
Message 2 of 6
(2,356 Views)

You can do it one of two ways. I don't know what 'chart went crazy' means. That's a techical term I am not familiar with.

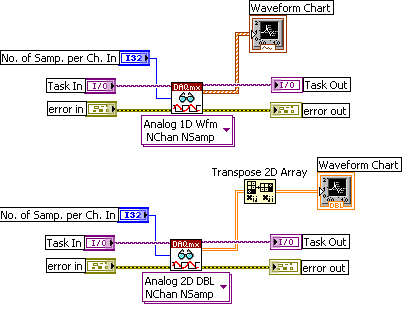
You should keep the diagram neat as well. If a small subVI is this messy, what can your main be like? Trusted Active Veteran or not, charts and arrays are pretty basic stuff. Have you taken any LabvIEW classes? There are some free ones here.


Message Edited by Dennis Knutson on 07-16-2008 08:03 AM
Message 3 of 6
(2,349 Views)
Hi GerdW,
 
Well the "crazy" part of the chart was finally due to a broken down function generator and to complicate matters it was not broke for good and only at times. Enough confusion there.
 
>>Well, is it really neccessary to store 10000 samples/s in a chart?
 
We are trying to capture a trend over a short span of about 5 seconds or so and would also be able to see it as it happens and so used a chart. At times t he client may want a longer duration and I t hought it was easy to handle this with a chart.
 
Thanks for your time. I have posted the final code in reply to Dennis's message. When things don't work as expected you start doubting the fundamentals and once we elimnate some variables the solution is close. ( Only after I saw the replies here I started looking at the hardware and sure enough there was an issue )
Raghunathan
LabVIEW to Automate Hydraulic Test rigs.
0 Kudos
Message 4 of 6
(2,322 Views)
Hi Dennis,
 
Thanks for your inputs. And yes the posting was quite basic - but then we were struggling to get basic plots and started doubting everything except the function generator and finally that turned out to be the culprit. When there are many variables it is better to rule some of them out and hence the query. Anyway now things are OK.
 
On the diagram neatness I do agree that there can be no short cuts. But then when posting just to convey the idea, I just asked my engineer to put together a quick-n-fast one. As to attending a free class on LV , I wish I could ! Maybe I will ask my engineer/s to attend;  by profession I am a mechanical engineer and specialize in oil hydraulics. LV for me is a sideline and interesting platform.
Raghunathan
LabVIEW to Automate Hydraulic Test rigs.
0 Kudos
Message 5 of 6
(2,315 Views)
Hi GerdW,
 
Your simple example was good to play around with and when run with "Highlight Execution" can follow  exactly how the array is built.
 
Now there is no problem in getting a neat plot with about 100 samples each channel at the rate of 2.5kHz ( yes I had toned down the frequency ) .
 
But I have a query on handling tha data part of it - suppose I want to take some decisions based on a particular value of say Ch.A, which is changing at a rate of less than 10Hz. I have collected 100 samples per scan and if i simply average it, I may loose the specific point altogether. [or] I can do a moving average over say some 1/10 of teh acquired samples and thus mainatin the trend of the waveform intact. Apart from these are there any methods of handling such data ? - I only need to drop the rogue values from the data and use t he rest which are following a trend.  Thanks.  
Raghunathan
LabVIEW to Automate Hydraulic Test rigs.
0 Kudos
Message 6 of 6
(2,294 Views)