- Subscribe to RSS Feed
- Mark Topic as New
- Mark Topic as Read
- Float this Topic for Current User
- Bookmark
- Subscribe
- Mute
- Printer Friendly Page
NI Vision Acquisition Histogram - Standard Variation
Solved!07-25-2019 12:37 PM
- Mark as New
- Bookmark
- Subscribe
- Mute
- Subscribe to RSS Feed
- Permalink
- Report to a Moderator
Hi everyone,
What is the difference between standard variation and standard deviation?
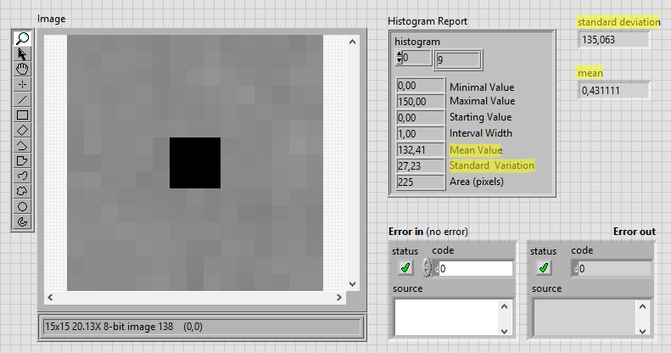
I'm using a 15x15 image in grayscale and these are the results of the histogram:
9, 0, 0, 0, 0, 0, 0, 0, 0, 0, 0, 0, 0, 0, 0, 0, 0, 0, 0, 0, 0, 0, 0, 0, 0, 0, 0, 0, 0, 0, 0, 0, 0, 0, 0, 0, 0, 0, 0, 0, 0, 0, 0, 0, 0, 0, 0, 0, 0, 0, 0, 0, 0, 0, 0, 0, 0, 0, 0, 0, 0, 0, 0, 0, 0, 0, 0, 0, 0, 0, 0, 0, 0, 0, 0, 0, 0, 0, 0, 0, 0, 0, 0, 0, 0, 0, 0, 0, 0, 0, 0, 0, 0, 0, 0, 0, 0, 0, 0, 0, 0, 0, 0, 0, 0, 0, 0, 0, 0, 0, 0, 0, 0, 0, 0, 0, 0, 0, 0, 0, 0, 0, 0, 0, 0, 0, 0, 0, 2, 3, 2, 7, 9, 9, 14, 19, 25, 36, 30, 10, 21, 12, 8, 4, 1, 2, 1, 0, 0, 1, 0, 0, 0, 0, 0, 0, 0, 0, 0, 0, 0, 0, 0, 0, 0, 0, 0, 0, 0, 0, 0, 0, 0, 0, 0, 0, 0, 0, 0, 0, 0, 0, 0, 0, 0, 0, 0, 0, 0, 0, 0, 0, 0, 0, 0, 0, 0, 0, 0, 0, 0, 0, 0, 0, 0, 0, 0, 0, 0, 0, 0, 0, 0, 0, 0, 0, 0, 0, 0, 0, 0, 0, 0, 0, 0, 0, 0, 0, 0, 0, 0, 0, 0, 0, 0, 0, 0, 0, 0, 0, 0, 0, 0, 0, 0, 0, 0, 0, 0, 0, 0, 0, 0, 0, 0
How can I get result Standard Variation (27,23) manually?


Thanks!
Solved! Go to Solution.
07-26-2019 02:30 AM
- Mark as New
- Bookmark
- Subscribe
- Mute
- Subscribe to RSS Feed
- Permalink
- Report to a Moderator
Okay, after looking into the documentation the Standard Variation is the simply Standard Deviation. No idea why LabVIEW gave it this confusing name that is not used elsewhere..
Question: why would you want to calculate it by hand, if you can extract it from the histogram?
But, if you want to do it manually it's possible.
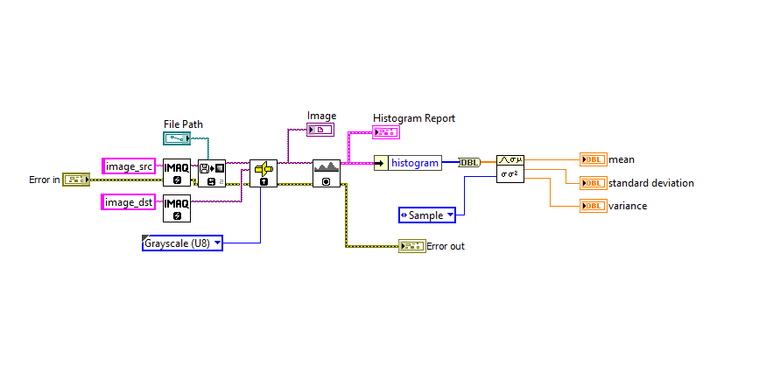
First off, the VI you posted is not correct; it converts all the numeric values in the histogram, i.e. minimal value, maximum value etc., into an array and calculates mean and SD from that. That does not make sense.
An image is simply a matrix (or 2D array) with numeric values - you can use the Image To Array VI for it. This matrix you can manipulate as you wish. LabVIEW's SD and Variance VI does not work with matrices, only arrays. A row-by-row calculation is cumbersome, so the easiest way is to calculate it yourself with the formula for SD (from Khan Academy):
The VI then looks something like this:
07-26-2019 03:47 AM
- Mark as New
- Bookmark
- Subscribe
- Mute
- Subscribe to RSS Feed
- Permalink
- Report to a Moderator
Hi irPaul,
Thanks for your answer but the results are different.
I really don't want to calculate it by hand, I'm documenting a work and I want to verify and explain each calculation.
I'm doing something wrong? I attached the image I'm using.
Thanks.
07-26-2019 08:04 AM
- Mark as New
- Bookmark
- Subscribe
- Mute
- Subscribe to RSS Feed
- Permalink
- Report to a Moderator
Oops, normally I'm very alert on integer overflows.
The image was 8-bit, so LabVIEW calculates with 8-bits (maximum value 255). Conversion to 32-bit solves this.
07-26-2019 10:45 AM
- Mark as New
- Bookmark
- Subscribe
- Mute
- Subscribe to RSS Feed
- Permalink
- Report to a Moderator


