- Subscribe to RSS Feed
- Mark Topic as New
- Mark Topic as Read
- Float this Topic for Current User
- Bookmark
- Subscribe
- Mute
- Printer Friendly Page
Mixed signal graph - time stamp as X-axis
06-04-2018 06:23 AM - edited 06-04-2018 06:24 AM
- Mark as New
- Bookmark
- Subscribe
- Mute
- Subscribe to RSS Feed
- Permalink
- Report to a Moderator
Hello.
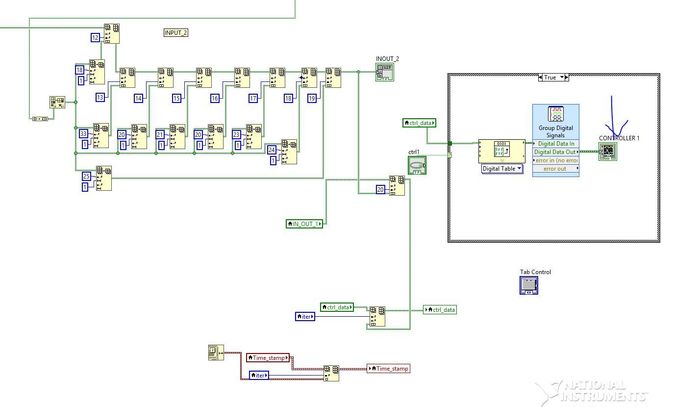
Currently I´m trying to paint a digital data as if they were a chonogram. Periodically I take samples and store them in order to avoid representing contiuously the data, which lags the equipment under test.
I have 40 signal and a time stamp for each sample in 2 variables.
On the image you can see how more or less data is created and time stamp is saved. My problem is how to include the Time Stamp as an X-Axes. Tried looking for it in properties of the mixed graph but couldn´t find it. Can you help me please. What I want is to load time stamp the representation.
PS: I also checked the forum before asking but couldn´t find the solution.
06-22-2018 07:09 AM
- Mark as New
- Bookmark
- Subscribe
- Mute
- Subscribe to RSS Feed
- Permalink
- Report to a Moderator
Hello dimitriy_88
Use Build Waveform function to add time to your digital data graph.
CLD Using LabVIEW since 2013


