From Friday, April 19th (11:00 PM CDT) through Saturday, April 20th (2:00 PM CDT), 2024, ni.com will undergo system upgrades that may result in temporary service interruption.
We appreciate your patience as we improve our online experience.
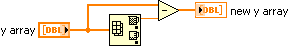
I have a program that will output to an xy-graph. I now want to change the axis so that the biggest value on my y-axis at the end of the measuremet is set as zero, and all other values changed with respect to the new zero point. I am not sure what i should do to accomplish this. I was wondering if anyone knows how this can be done. The graph is created in a sub-VI and outputed to the main VI afterwards.
