- Subscribe to RSS Feed
- Mark Topic as New
- Mark Topic as Read
- Float this Topic for Current User
- Bookmark
- Subscribe
- Mute
- Printer Friendly Page
Harmonic Distortion
12-07-2020 03:49 PM
- Mark as New
- Bookmark
- Subscribe
- Mute
- Subscribe to RSS Feed
- Permalink
- Report to a Moderator
I am taking measurements of acceleration, speed and rotational movement and I keep that data in a txt file. After having these measurements recorded I want to make a harmonic distortion, and find the specific harmonics / fundamental harmonics, the one that predominates.
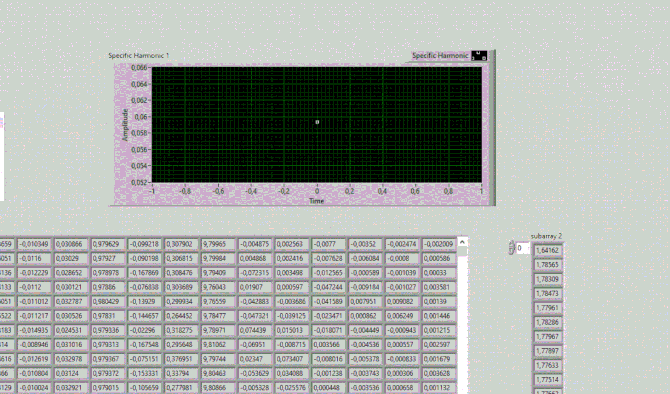
I am using the distortion measurements function but when I press it it appears (image 1) but the problem is that it only gives me this output (image 2), do not give me a graph with frequency, why ??
If anyone can help me I appreciate it.
My output:
12-07-2020 03:55 PM
- Mark as New
- Bookmark
- Subscribe
- Mute
- Subscribe to RSS Feed
- Permalink
- Report to a Moderator
My code
12-08-2020 07:55 AM
- Mark as New
- Bookmark
- Subscribe
- Mute
- Subscribe to RSS Feed
- Permalink
- Report to a Moderator
Please attach your code. We need something we can edit, dissect, even run (it also might help to attach a Data File so we can see what your code does with your data). The best way to attach the code is to compress the folder containing your LabVIEW Project and attach the resulting .zip file. A picture (tiny!) of a small piece of your code is not so helpful.
Bob Schor
12-08-2020 09:02 AM - edited 12-08-2020 09:04 AM
- Mark as New
- Bookmark
- Subscribe
- Mute
- Subscribe to RSS Feed
- Permalink
- Report to a Moderator
Thank you, here are the files.
Ricardo Rebelo
12-09-2020 01:11 AM
- Mark as New
- Bookmark
- Subscribe
- Mute
- Subscribe to RSS Feed
- Permalink
- Report to a Moderator
Hi Ricardo,
please don't SPAM people by asking for help using PersonalMessages! This is considered "rude behaviour"…
@RicardoRebeloo1 wrote:
I want to make a harmonic distortion, and find the specific harmonics / fundamental harmonics, the one that predominates.
Your VI does exactly what you want to do: find the one (1) dominating harmonics value!
Your example data file contains just 4 samples per columns, so determining harmonics from them seems rather senseless…
12-09-2020 08:34 AM
- Mark as New
- Bookmark
- Subscribe
- Mute
- Subscribe to RSS Feed
- Permalink
- Report to a Moderator
OK, sorry. But I am not able to obtain the results graph as shown in the figure. I used the file with only 4 data, but I used another with more data and it still doesn't work.
12-09-2020 08:37 AM
- Mark as New
- Bookmark
- Subscribe
- Mute
- Subscribe to RSS Feed
- Permalink
- Report to a Moderator
OK, sorry. But I am not able to obtain the results graph as shown in the figure. I used the file with only 4 data, but I used another with more data and it still doesn't work.
12-09-2020 08:47 AM
- Mark as New
- Bookmark
- Subscribe
- Mute
- Subscribe to RSS Feed
- Permalink
- Report to a Moderator
Hi Ricardo,
so you don't want the results of that ExpressVI (SINAD, amplitude of first harmonic), but you want that FFT plot shown as "Preview"!?
Why don't you call a FFT function in your VI?
Did you know you can convert each ExpressVI into an ordinary VI and look into its block diagram (and subVIs)? That often helps to create a subVI to its own requirements!
ExpressVIs are not made for your specific requirements, but only to fulfill the most often used requirements: this can be a huge difference…
12-09-2020 10:23 AM
- Mark as New
- Bookmark
- Subscribe
- Mute
- Subscribe to RSS Feed
- Permalink
- Report to a Moderator
I want to find out which frequency predominates, that is, the fundamental harmonics.


