- Subscribe to RSS Feed
- Mark Topic as New
- Mark Topic as Read
- Float this Topic for Current User
- Bookmark
- Subscribe
- Mute
- Printer Friendly Page
Continuous Waveform Output of acquired data
03-19-2011 04:53 PM
- Mark as New
- Bookmark
- Subscribe
- Mute
- Subscribe to RSS Feed
- Permalink
- Report to a Moderator
Hi,
I am using labview to read values from my processor using serial communication and VISA.
Using a VISA READ I display these values with a text indicator and the output is correct.
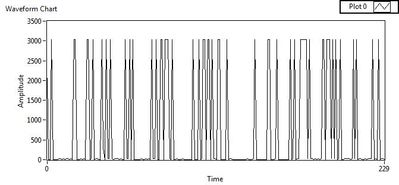
Then, I take that output, pass it through a 'decimal string to number converter' and give it to a Strip Chart. But, instead of giving me a continuous waveform of that value, it gives me a discrete kind of output and that too aperiodic.
For eg, I am reading a value of 3030 continuously. The text indicator is showing the corect value, but the strip chart looks like this :
What can I do to get a proper staraight line at 3030? Or if sine values are given in, then how to make the strip chart show a continuous sine wave instead of a 'stem' like output?
03-19-2011 05:04 PM
- Mark as New
- Bookmark
- Subscribe
- Mute
- Subscribe to RSS Feed
- Permalink
- Report to a Moderator
It looks like the values you are displaying is not in the same cycle as the input values (my guess is that the reading the input value is not in the same loop as your chart output, hence the 0 in your display. This is just a guess). You should display how your VI looks in gathering and displaying the data.
03-20-2011 02:34 AM
- Mark as New
- Bookmark
- Subscribe
- Mute
- Subscribe to RSS Feed
- Permalink
- Report to a Moderator
@SoniaSanghvi wrote:
Then, I take that output, pass it through a 'decimal string to number converter' and give it to a Strip Chart. But, instead of giving me a continuous waveform of that value, it gives me a discrete kind of output and that too aperiodic.
Have you tried to put it (the entire array of numbers) into a graph?
- Bjorn -
Have fun using LabVIEW... and if you like my answer, please pay me back in Kudo's 😉
LabVIEW 5.1 - LabVIEW 2012

