- Subscribe to RSS Feed
- Mark Topic as New
- Mark Topic as Read
- Float this Topic for Current User
- Bookmark
- Subscribe
- Mute
- Printer Friendly Page
All VIs in Memory returns lots of instances of same VI
Solved!04-27-2022 11:06 AM
- Mark as New
- Bookmark
- Subscribe
- Mute
- Subscribe to RSS Feed
- Permalink
- Report to a Moderator
Background: Hi all. I am debugging some code that was written by someone else. Its a large application with lots of VIs that run in parallel (QMH architecture). The application has trouble exiting. After exiting, I am noticing tons of VIs remain in memory. There is obviously some code that is hanging up somewhere, e.g. one of the QMH's is hung up and not exiting.
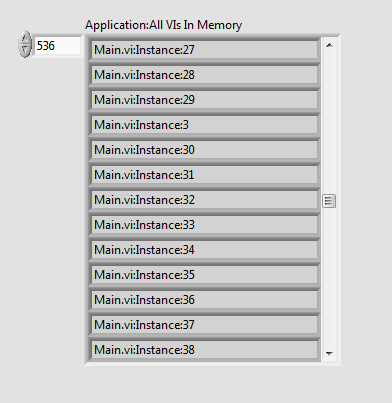
Question: My question is very specific. After the application exits, I use the "All VIs Memory" application property node and it shows there are tons of VIs in memory, including multiple instances of the Main vi (see below). Can someone give me some clues as to why this might happen? Are these just VI references that were left open? I thought this property node would only return a list of actually VIs in memory ... not a list of references? Or does opening certain kinds of VI references load the entire VI into memory?
Solved! Go to Solution.
04-27-2022 11:42 AM
- Mark as New
- Bookmark
- Subscribe
- Mute
- Subscribe to RSS Feed
- Permalink
- Report to a Moderator
All VIs in Memory didn't used to return clones, but at least some clones seem to turn up in LV20.
At a glance, only 'static' clones, clones created as a sub VI, are returned. Dynamically created clones don't seem to show. If this is what's happening, it's exactly the reverse of what would be useful...
Not sure if this is a (new?) bug or (new?) feature.
04-27-2022 11:53 AM
- Mark as New
- Bookmark
- Subscribe
- Mute
- Subscribe to RSS Feed
- Permalink
- Report to a Moderator
Thanks for the comments, wiebe@CARYA.
I am confused how this application could be launching so many clones of its Main.vi.
The Main.vi is the top-level VI. And it is not re-entrant.
04-27-2022 12:35 PM
- Mark as New
- Bookmark
- Subscribe
- Mute
- Subscribe to RSS Feed
- Permalink
- Report to a Moderator
You say the application is using a QMH architecture. Most of those use asynchronously called VIs in either call+collect or call+forget modes.
If it's taking forever to close it could be that some of those aren't closing and are remaining in memory, so LabVIEW's memory management has to take a while to sort out what it can clean up and what it can't.
If some of those VIs are linked back to the calling main VI in some way then maybe it's doing something strange where it leaves "ghost" references to the calling main VI loaded in memory due to the still running asynchronous calls? I'm not on 2020 yet so I can't check to see if it does this.
Is this something you can check the growth rate of? I.E. if you repeatedly do a fresh start of LabVIEW, start your main VI, do the same things, and then exit and check the "All VIs in Memory", does it always increase by the same amount of copies?
04-28-2022 03:05 AM
- Mark as New
- Bookmark
- Subscribe
- Mute
- Subscribe to RSS Feed
- Permalink
- Report to a Moderator
@josborne wrote:
Thanks for the comments, wiebe@CARYA.
I am confused how this application could be launching so many clones of its Main.vi.
The Main.vi is the top-level VI. And it is not re-entrant.
The instance numbers are weird too.
Something might be very wrong. Usually those clone numbers are GUIDs (static clones) or I32 hashes (dynamic clones), not the sequential numbers (that actually make sense) you're getting.
Although nothing is documented... Last I heard, VI Server references to clones are officially not supported.
04-28-2022 04:29 AM - edited 04-28-2022 04:48 AM
- Mark as New
- Bookmark
- Subscribe
- Mute
- Subscribe to RSS Feed
- Permalink
- Report to a Moderator
I remember taking over an extensively QMH driven Labview software package, with way too many of these Queues. Removed those unneeded ones, introduced a global "Alive" flag to signal closure. The "Alive" flag took care to stop any loops that might be otherwise left hanging. Then took care of the main structure to always follow specific minimum steps in application opening and closing. I also took care to always open and close files and connections once, and to Exit the application with all files and connections naturally (=not forced) closed. It took time to change and implement, but it is still working fine 5 labview versions later.
Edit:
Thinking back I also remembered the previous software engineer had often used (communication) time-outs that were way too long. Waiting one or two minutes where the actual time-out should be around perhaps 3 seconds. Changed those to something like 5 seconds, or something else suitable. Also the old code often used 100% cpu, which currently only happens calling a dll that is waiting for some reply.
04-28-2022 05:11 AM
- Mark as New
- Bookmark
- Subscribe
- Mute
- Subscribe to RSS Feed
- Permalink
- Report to a Moderator
This is my second attempt to reply here, as my first reply seems to have dissapeared.
I remember taking over an extensively QMH driven Labview software package, with way too many of these Queues. Removed those unneeded ones, introduced a global "Alive" flag to signal closure. The "Alive" flag took care to stop any loops that might be otherwise left hanging. Then took care of the main structure to always follow specific minimum steps in application opening and closing. I also took care to always open and close files and connections once, and to Exit the application with all files and connections naturally (=not forced) closed. It took time to change and implement, but it is still working fine 5 labview versions later.
I also recall the previous software engineer using time-outs that were way too long (minutes in stead of the required seconds). The code often used 100% cpu, which it now seldom does.
My experience with Labview is that there are all kinds of dependancies (unclosed connections, files, not properly ending loops) that can keep resources from closing properly. I am currently on Labview 2018, so no idea if Labview 2020 is misbehaving badly somehow. But following the approach I took I'm pretty confident my code would remain working solidly.
04-28-2022 08:49 AM
- Mark as New
- Bookmark
- Subscribe
- Mute
- Subscribe to RSS Feed
- Permalink
- Report to a Moderator
@Ettepet wrote:My experience with Labview is that there are all kinds of dependancies (unclosed connections, files, not properly ending loops) that can keep resources from closing properly.
That specifically is exactly the same for most other programming languages (although some languages close references when the scope ends, they don't when you explicitly open them). Surely if you don't close a loop (properly?), it keeps looping.
More generally, programming languages tend to do what you tell it to. If it's not correct, the behavior is not correct.
This thread is about a QMH problem. So even if it is a bug, it's probably a QMH bug. As it's the first time the problem is reported, I doubt it is a QMH problem, but a problem with using QMH.
04-29-2022 08:13 AM - edited 04-29-2022 08:15 AM
- Mark as New
- Bookmark
- Subscribe
- Mute
- Subscribe to RSS Feed
- Permalink
- Report to a Moderator
Hi all,
Thanks for all your comments on this. As you may have noticed, I am dealing with two issues here:
- When exiting QMH-based application, multiple parallel loops are left running (incomplete/ungraceful exit).
- While investigating problem #1, I discovered lots of "ghost" clones of my Main.vi. This may not actually be a problem, but it is suspicious and interesting to me, so I am going down the rabbit hole of investigating this issue also.
I'd like to focus on problem #2 for now. And here is some additional detail:
I noticed that if I just open my Main.vi and don't run it, it still causes lots of clones to appear in the list of All VIs in Memory. Over 100+ clones of Main.vi! Because the code hasn't even run yet, I don't think this could be an issue with references or even the QMH architecture, right? I'll keep investigating.
04-29-2022 08:20 AM
- Mark as New
- Bookmark
- Subscribe
- Mute
- Subscribe to RSS Feed
- Permalink
- Report to a Moderator
Interesting! I fgured this out. An its amusing.
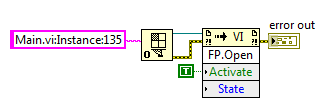
If I just open my Main.vi, I noticed it creates lots of clones of "itself"... but then I use a quick call to VI Server to open one of these clones like this:
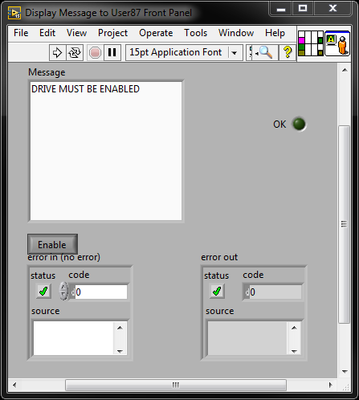
And it opens this VI (the "Display Message to User" express VI) ... not sure I can explain that one yet.


