LabVIEW Idea Exchange

cancel
Showing results for 
Search instead for 
Did you mean: 
0 Kudos
dadreamer

Improve DbgPrintf Debugging Window

Status: Declined

Any idea that has not received any kudos within a year after posting will be automatically declined. 

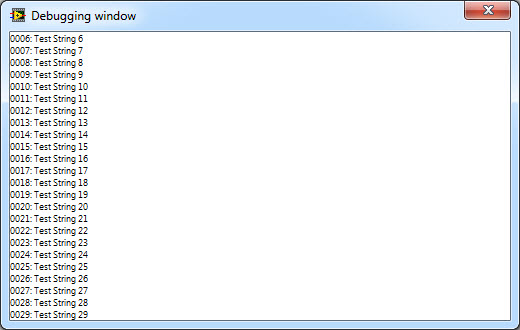
LabVIEW has nice debugging window which is very helpful for DLL debugging purposes. It's able to output numeric variables, strings, LV paths and so on. But it also lacks some standard functionality that makes it not very comfortable to use. Currently this window looks like that:


DbgPrintf window


First main disadvantage of this style is that the window has no scrollbars so we can only see last 24 rows of text. Older strings are completely unavailable if they are not cleaned up from memory at all. Second disadvantage is that user cannot copy or export that debug text to clipboard or text file. It's especially important when working with large numbers or complex data which is hard-to-remember and hard to rewrite by a hand. And third disadvantage is that the window misses some standard elements which almost any window has: minimize/maximize buttons, right bottom resize corner etc.


Because of these drawbacks I'm forced to give up this DbgPrintf function and use standard Windows console window (AllocConsole / FreeConsole from WinAPI). That requires additional work in the code and not so easy to use as the mentioned function. Also it's not cross-platform way of debugging.


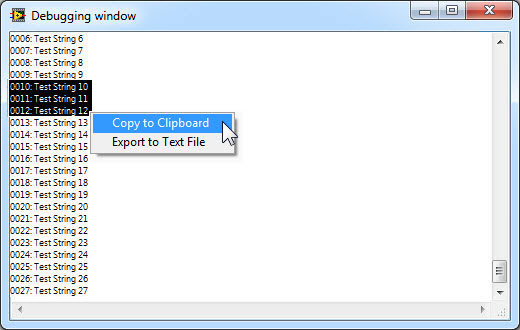
So, it would be perfect if that window looked like that:


DbgPrintf (new look)


As you can see there are new abilities of the window:

1. It has both horizontal and vertical scrollbars, so all the text can be read;

2. It allows to select the text and copy/export it to clipboard or .txt file;

3. It has minimize/maximize buttons on the title bar;

4. It has right bottom resize corner which is used to change window size;


That's the basic functional but there may be some additional settings for window appearance or for ease of debugging.

10 Comments
X.
Trusted Enthusiast
Trusted Enthusiast

By DLL, you mean CIN? From my recollection (and the Help), DbgPrintf is something that is only understood by code compiled as a CIN.

A bit out of topic (but also to dampen your hope that there will be any fix to this old limitation of the debug window - which is a general  obsolescence problem with LabVIEW), the future Next Generation LabVIEW appears to have a C-Node, in which C code will be executed in the same thread as LabVIEW. I wonder what debugging mechanism is planned here?

dadreamer
Active Participant

X.

You can call DbgPrintf from any library linked to labview.exe, it's not necessary to use it from CINs. This function may be called even from LabVIEW itself (although there's not so much sense for it as it's easier to debug VIs with probes or indicators):


Calling DbgPrintf from VI


extcode.h defines DbgPrintf to be used in any DLL which is written on C/C++. For other IDEs there's a possibility to define the functions from labview.exe dynamically.


Well, I had a look at that article but have not fully understood what it is, when it will be released and in which form. Even if it is futuristic view of LabVIEW after 5-10 years, it has very little amount of info about how it would be implemented (if would be at all). As I know there's already Inline C Node for embedded platforms (but not for desktop targets). Almost 10 years ago there was no plans to extend that functionality to PC OS'es (Windows / Mac / Linux) due to the need of built-in C compiler. Well, the time has passed and something's changed maybe. At least I want to believe. Smiley Wink

X.
Trusted Enthusiast
Trusted Enthusiast

I stand corrected.

You can try it yourself. Go to the community landing page and check the NI software technology preview community.

dadreamer
Active Participant

X.

I don't have access to that page somehow. Probably I don't appear to be a member of some closed group, idk.

X.
Trusted Enthusiast
Trusted Enthusiast

I am a nobody, so I don't believe I am treated any differently than you are.

You are not seeing this:

Screen Shot 2016-08-27 at 08.42.10.png

dadreamer
Active Participant

X.

I don't see such item in the forum menus. When I follow your link, I'm seeing this:

No access


Hope, someone at NI will explain that.

X.
Trusted Enthusiast
Trusted Enthusiast

Oh, now I remember something. I did apply to the preview program but never got an answer. I guess I did get approved and this is why I see these things and not you.

Here's the link to the application form: http://www.ni.com/en-us/support/software-technology-preview.html

crossrulz
Knight of NI

You have to have a valid SSP and apply for the Technology Preview.  Those are the only requirements.


GCentral
There are only two ways to tell somebody thanks: Kudos and Marked Solutions
Unofficial Forum Rules and Guidelines
"Not that we are sufficient in ourselves to claim anything as coming from us, but our sufficiency is from God" - 2 Corinthians 3:5
dadreamer
Active Participant

Still not enhanced in NXG 1.0:

DbgPrintf in NXG


Please, vote to get easier debugging of DLLs in newest LV products! Cat Wink

Darren
Proven Zealot
Status changed to: Declined

Any idea that has not received any kudos within a year after posting will be automatically declined.