View Ideas...
Labels
Idea Statuses
- New 2,936
- In Development 0
- In Beta 1
- Declined 2,616
- Duplicate 698
- Completed 323
- Already Implemented 111
- Archived 0
Top Authors
| User | Kudos |
|---|---|
| 18 | |
| 5 | |
| 4 | |
| 4 | |
| 4 |
Turn on suggestions
Auto-suggest helps you quickly narrow down your search results by suggesting possible matches as you type.
Showing results for
Options
- Subscribe to RSS Feed
- Mark as New
- Mark as Read
- Bookmark
- Subscribe
- Printer Friendly Page
- Report to a Moderator
Desktop Execution Trace Toolkit should be able to present data graphically
Submitted by
 Taylorh140
on
05-06-2020
11:30 AM
Comment
Status:
New
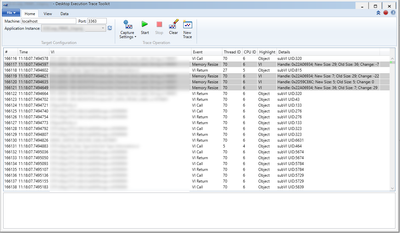
Currently, DETT looks like this:
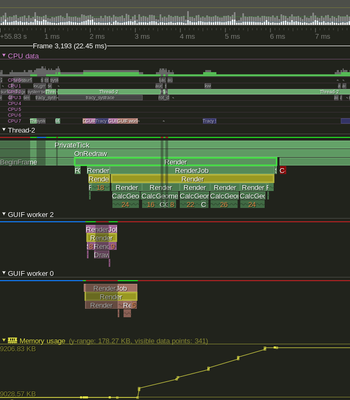
But it should look like a proper profiler allowing for exploring and easily visualizing performance, threads, call stacks and memory usage at a glance (similar to this):
You must be a registered user to add a comment. If you've already registered, sign in. Otherwise, register and sign in.


