Turn on suggestions
Auto-suggest helps you quickly narrow down your search results by suggesting possible matches as you type.
Showing results for
Topic Options
- Subscribe to RSS Feed
- Mark Topic as New
- Mark Topic as Read
- Float this Topic for Current User
- Bookmark
- Subscribe
- Mute
- Printer Friendly Page
I want different color in XY graph (Specific band)
Member
07-23-2015 02:59 AM
Options
- Mark as New
- Bookmark
- Subscribe
- Mute
- Subscribe to RSS Feed
- Permalink
- Report to a Moderator
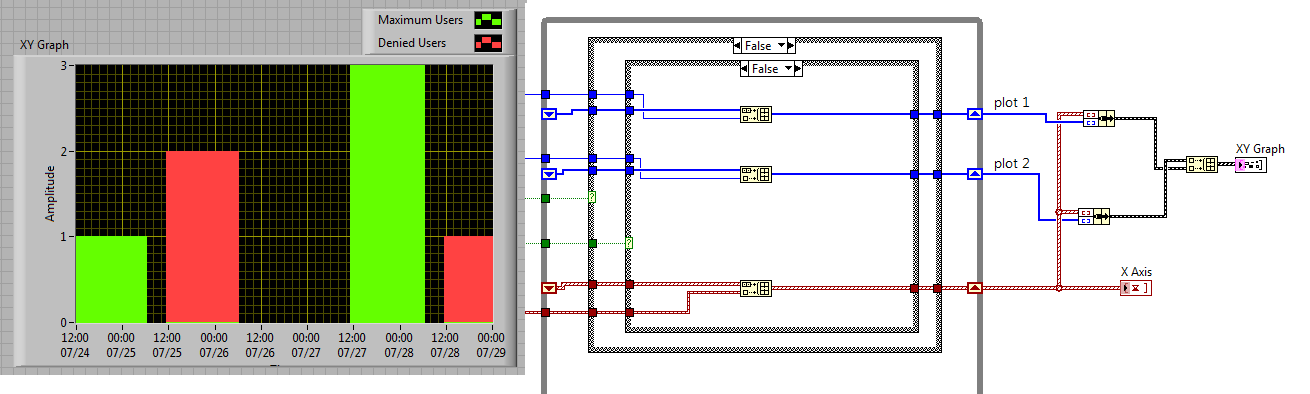
I want different color in XY graph (Specific band) examle figure.. How to display left-blue and right-green???
Member
07-23-2015 07:56 AM
Options
- Mark as New
- Bookmark
- Subscribe
- Mute
- Subscribe to RSS Feed
- Permalink
- Report to a Moderator
I did this last time where my customer requested a stackup of 2 bar graphs. Anyway, both my scenario and yours can be met by adding another plot of different color. Add another plot with blue colour and let it have value where you want the plot to be blue. Same goes for the green plot. To 'remove' the plots where they are 0, just set the value to NaN. In short, create two 1D array (1 is blue plot, 1 is green plot). Bundle each array with the x-axis array. Build the two clusters to an array before wiring them to the XY graph.