- Document History
- Subscribe to RSS Feed
- Mark as New
- Mark as Read
- Bookmark
- Subscribe
- Printer Friendly Page
- Report to a Moderator
- Subscribe to RSS Feed
- Mark as New
- Mark as Read
- Bookmark
- Subscribe
- Printer Friendly Page
- Report to a Moderator
University of North Carolina at Charlotte: Thrust Modulation of a Solid Fuel Rocket Motor
Contact Information
University: University of North Carolina at Charlotte
Team Members (with year of graduation): Jerry Dahlberg, Caleb Watts, John Cappelletti, Dewey Greer, Daniel Saulnier, Robert Stone, Daniel Deese, Matthew Perry, Benjamin Griffiths (All Graduate in 2014)
Faculty Advisers: Dr. Karen Thorsett-Hill
Email Address: jdahlbe2@uncc.edu and k.thorsett-hill@uncc.edu
Submission Language: English
Project Information
Title: NASA Student Launch Project with Solid Fuel Rocket Motor Thrust Modulation.
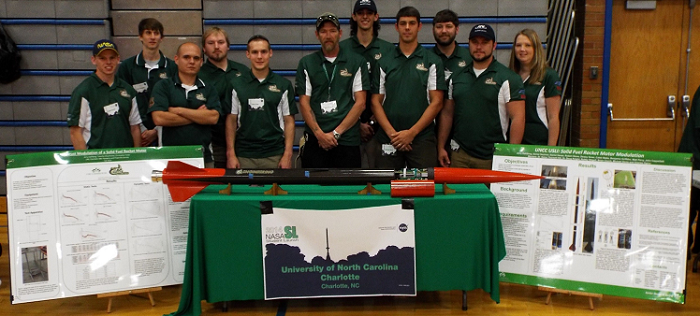
Figure 1: UNC Charlotte Student Launch Team
Description:
The project was to design and build a reusable launch vehicle capable of attaining a pre-determined altitude while carrying a multiple scientific payloads. The payload consisted of two separate, myRIO controlled systems which included a dynamic thrust modulation system, ground hazard identification system, atmospheric sensor package, as well as a dynamic analysis of structural elements.
Products: (NI)
LabVIEW 2013, Measurement and Automation Explorer 5.5.1, NI myRIO, Ni-IMAQ 4.8, Ni myRIO module 1900-03037f3b and NI myRIO module 1900-03039061.
Products: (Other)
Eight megapixel (MP) Logitech C525 HD Webcam, IMU Orientation Sensor with 3-axis accelerometer, magnetometer, gyroscope, and separate pressure sensor, Adafruit Ultimate GPS Breakout GPS module, Xbee-Pro S3B Transmitter, CDS Photoconductive cells, BMP-085 Temperature/Pressure sensor, HS-7950TH High-torque servo, Texas Instruments LM1117 (2x), Adafruit ADXL326 breakout, SparkFun HIH4030 breakout, Strain gauges (KFG-3-120-C1-11L1M 0˚-45˚-90˚ strain gauge rosettes) (6x), Texas Instruments LM324 (2x)
The Challenge:
The largest portion of the project involved dynamically controlling the thrust from a solid fuel rocket motor during motor burn to achieve a desired altitude, as well as conducting a dynamic analysis of propulsion during boost and protuberances during flight. To date, NASA has not successfully implemented a thrust modulation system on a solid fuel rocket. Modulating thrust in a liquid fuel motor is achieved by altering the air-fuel mixture in the motor, which is not possible in a solid fuel motor. Experimentation was required to determine a method to modulate thrust during motor burn of a solid fuel motor. A variable nozzle extension, activated by a high torque servo motor and controlled via a closed-loop system with feedback from an onboard accelerometer served to modulate thrust during the motor burn, which only lasted 3.69 seconds. This modulation decreased the efficiency of the thrust and allowed the team to decrease acceleration, and limit the final altitude to near the desired 3100 feet. This system operated on a NI myRIO DAQ/microcontroller, which also record the data received from the strain gauges mounted at strategic locations on the vehicle and in the modulation system. Based on the launch vehicle size, mass and engine thrust the vehicle should have attained an altitude of 4,900 feet, 1,800 feet higher than the team mandated 3,100 feet.
The second payload module incorporated a ground scanning hazard detection camera which ran independently of the thrust modulation system, and employed a high-definition 5MP digital camera to scan the landing area to locate any landing hazards. The camera deployed and activated at 800 feet above the landing area, and scanned the area processing the data to determine if any pre-specified hazards were visible in the camera’s field of vision. All data was processed onboard via a separate myRIO unit, along with data from various atmospheric sensors to determine ambient conditions during descent.
Figure 2 shows the launch vehicle flight plan with key tasks that are conducted by each of the myRios.
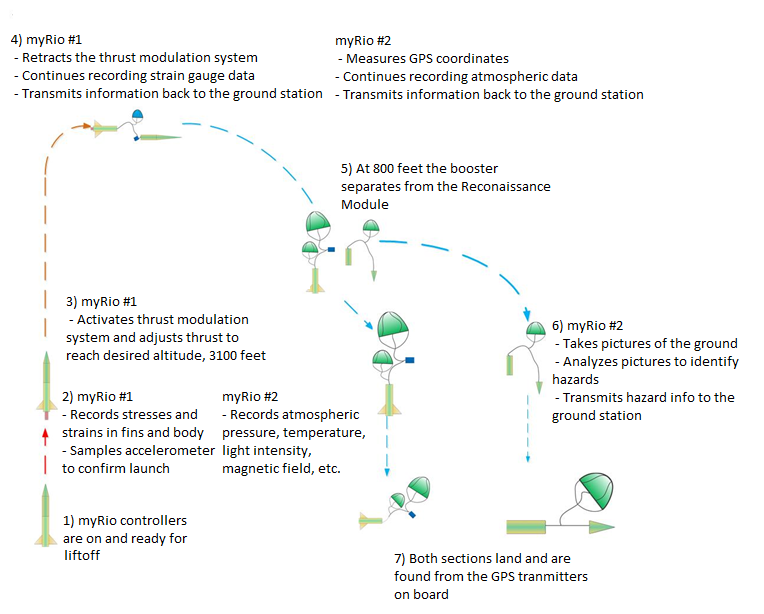
Figure 2: Flight Plan with myRio Tasks
The Solution:
To complete the project, the team was divided into two separate teams: the vehicle team and the payload team. The vehicle team was responsible for the design, construction and testing of the launch vehicle and recovery systems. The payload team was responsible for the design, construction and testing of the electronics, as well as the programming of the two independent payload systems. The teams worked together to research and conduct ground testing on the thrust modulation system.
The Launch Vehicle:
The launch vehicle is comprised of four major sections: the nose cone, the reconnaissance module payload bay, the main parachute bay and thrust modulation payload section, and the fin can/ propulsion section (Figure 3).

Figure 3: Launch vehicle overview
The vehicle is 93 inches in height, with a nominal outside diameter of 4 inches and an inside diameter 3.875 inches. The masses of the fully-loaded vehicle with and without the motor are 25.56 and 22.96 pounds, respectively. The motor that was used in all of the flights was a Cesaroni Technology Pro54 K660-17A, which had a burn time of 3.69 seconds, a total impulse of 548.33 lbf-s, an average thrust of 148.28 lbf, and a maximum thrust of 242.75 lbf, giving the rocket a maximum acceleration of 8.54 times gravity. The launch vehicle was constructed by the team. The team rolled carbon fiber tubes for the lower sections of the vehicle with the atmospheric sensor package near the top of the vehicle incased in a fiberglass sleeve. The nose cone, also constructed by the team was made of fiberglass and the slider was machined from 6061 aluminum as seen in Figure 4.
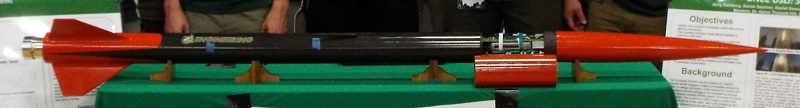
Figure 4: Launch Vehicle with Payloads
Payload
Reconnaissance Module
Figure 5 shows the model of the reconnaissance module.
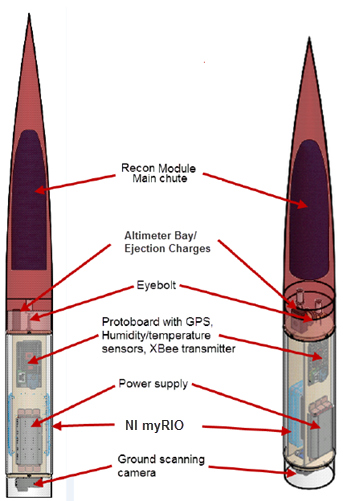
Figure 5: Reconnaissance Module Assembly
The reconnaissance module is located in the upper section of the launch vehicle, and separates from the booster section at apogee. This module has its own main parachute, and houses the ground scanning hazard detection system. The ground scanning hazard detection camera uses a high-definition (up to 8MP still photos) digital camera to scan the landing area to locate any landing hazards. The reconnaissance module also houses an atmospheric sensor package, which measured solar irradiance, temperature, humidity, and barometric pressure. All data is processed onboard via one of the myRIO units.
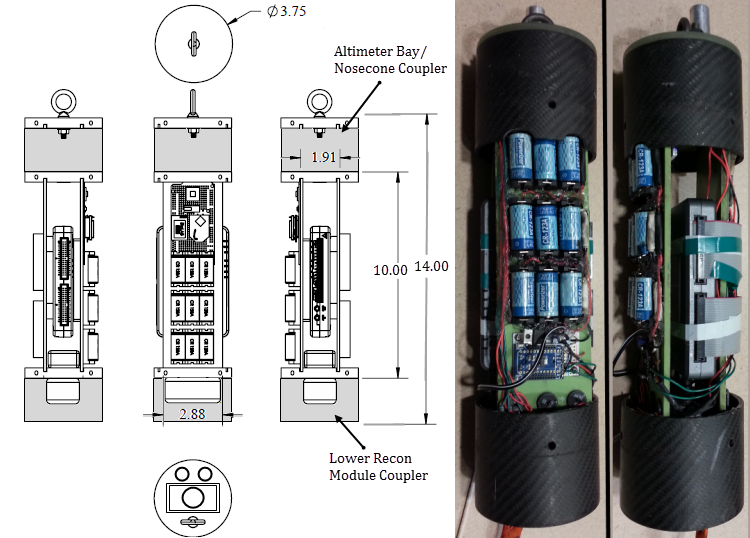
Figure 6: Reconnaissance Module Layout
The ground scanning hazard detection system consists of an 8 megapixel (MP) Logitech C525 camera positioned at the bottom of the reconnaissance module (Figure 6), and connected to the myRIO via a high-speed USB 2.0 port capable of transmitting data up to 480 Mbit/s. Once the reconnaissance module has separated from the launch vehicle at 800 feet, the position of the parachute attachment and the location of the camera ensured that it is facing the landing surface during descent. The camera took one picture per second, and the image was be analyzed in the onboard myRIO. Connected component labeling was used, enabling the microprocessor to analyze and identify pixels of the photos over the RGB spectrum through the use of a single pass algorithm. Hazards in this application were defined as any protrusions on an otherwise flat surface (i.e. the salt flats, or the surface of an alien planet or moon) that would impede a safe landing (In the case of an extra-terrestrial landing, the GPS module would be inoperable and therefore omitted, but was used during test flights). These hazards were then identified by the shadows they produce. The algorithm identified hazards based on the colors of the image, effectively locating “dark” regions. This algorithm was used in determining the position and size of the hazard through use of the image processing and the GPS sensor on the module. It then relayed the information about the hazard to a ground station via one of two onboard X-Bee transmitters, as well as storing the data onboard.
In addition to the ground scanning hazard detection system, the reconnaissance module also housed an atmospheric sensor package. This system recorded solar irradiance, barometric pressure, temperature and humidity via the same myRIO. An independent inertial measurement unit (IMU) recorded the entire flight via 3-axis accelerometer, magnetometer, gyroscope, and separate pressure sensor. The data from the IMU in correlation with GPS data allowed for a 3-dimensional model of the flight path to be generated, and also validated data from the other sensors and accelerometers. The specific components for the atmospheric sensor package are listed below.
8 MP Logitech C525 HD Webcam
National Instruments myRIO DAQ/microcontroller
IMU Orientation Sensor with 3-axis accelerometer, magnetometer, gyroscope, and separate pressure sensor
Adafruit Ultimate GPS Breakout GPS module
Xbee-Pro XSC Transmitter
CDS Photoconductive cells
BMP-085 Temperature/Pressure sensor
HIH-4030 Humidity sensor
ADXL326 Accelerometer
Figures 7, 8 and 9 show the reconnaissance module from different orientations
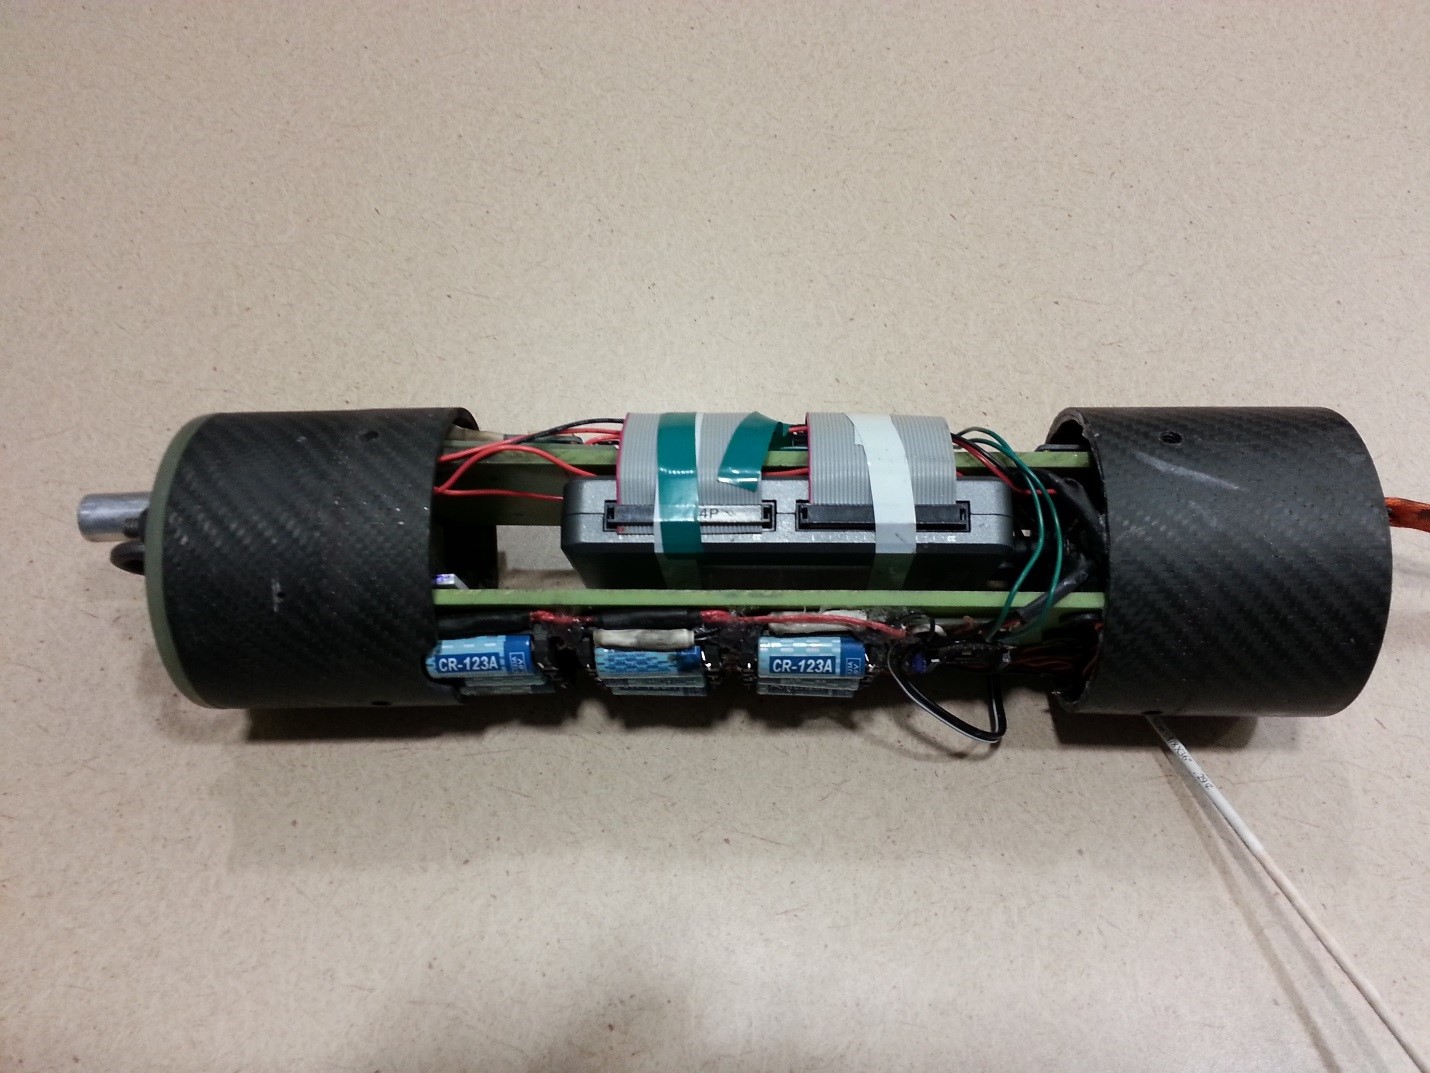
Figure 7: Reconnaissance Module with myRio (Side View)
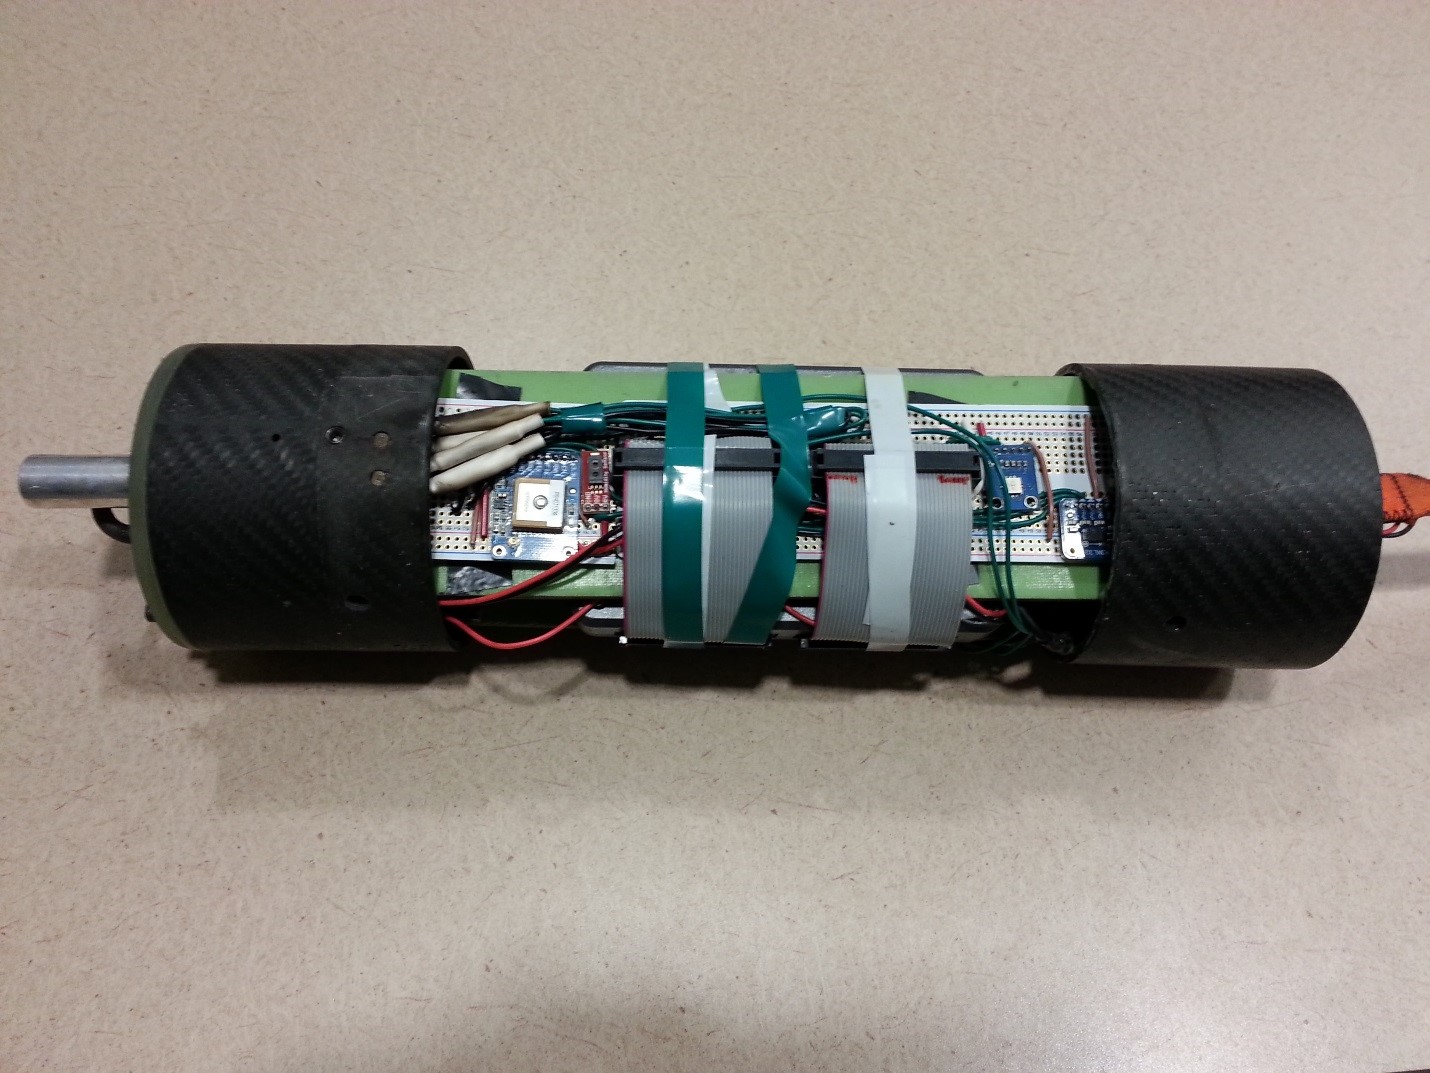
Figure 8: Reconnaissance Module Wiring and Protoboard (Side View)
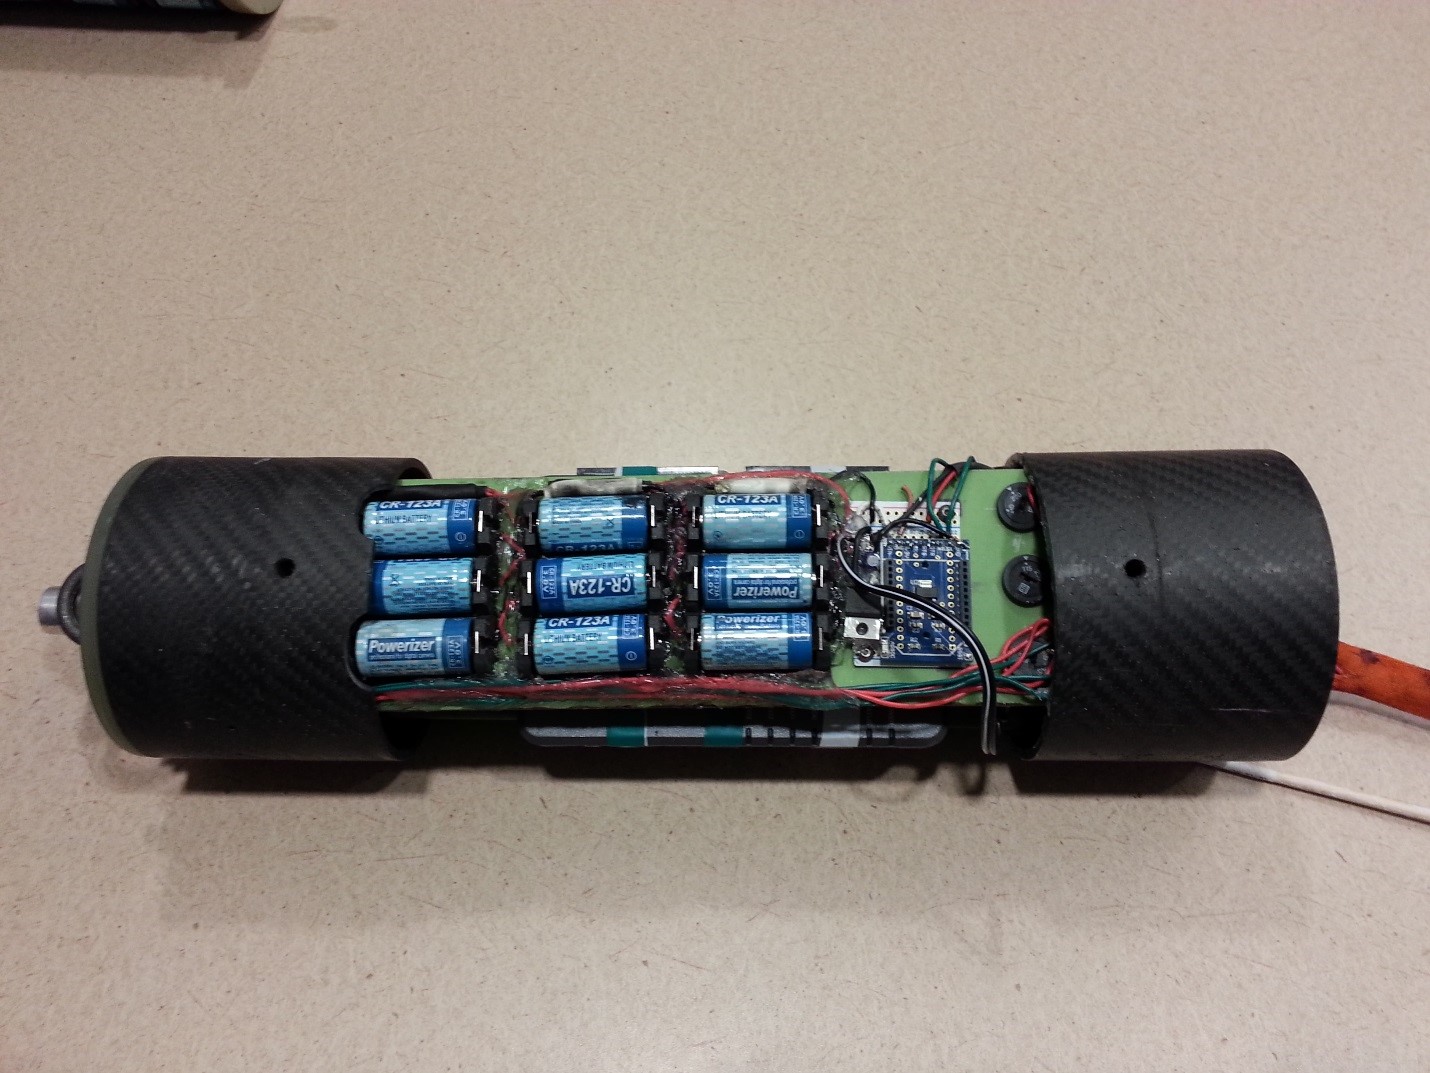
Figure 9: Reconnaissance Module Power Supply and Sensors (Side View)
Reconnaissance Module and myRIO Controller
At 800 feet, the ground scanning camera in the reconnaissance module camera will activate and start to acquire pictures in JPEG format. The system tries to match and find a preset region of interest that the team has dubbed a hazard. It will recognize a hazard by a preset template already recorded on the FPGA board. For this experiment, the color red was deemed a hazard due to its representation of heat. These two images will be compared using the “match color pattern” function featured in IMAQ vision, a library of LabVIEW. Utilizing this function these two images will be compared producing a score of closeness between the two items. The minimum score will be predetermined to figure out what the sufficient score must be to be a match. The parameters which dictate the score are as follows: minimum contrast, match mode, match feature mode, sub-pixel accuracy, color sensitivity, and search strategy. The resultant number of matches was then sent to an Xbee unit onboard the rocket to be transmitted to a ground station.
Experimental Process and Procedures
In order to properly calibrate the parameters of the function, a preselected red target (a red fabric cloth) was acquired for testing. This cloth, measuring 12 feet by 15 feet, was placed on the ground floor of a parking deck. The camera was then manually swept across the area from the upper floor of the deck until adequate parameters of the LabVIEW function were determined in order to obtain a match. This was done to try to counter the resulting effect of the color temperature. The parameters can be seen below. The color weight score that was set as a match was determined to be 500.
Minimum Contrast | 0 |
Match Mode | Shift Variant |
Match feature mode | Color |
Sub-pixel accuracy | FALSE |
Color Sensitivity | Low Sensitivity |
Search Strategy | Conservative |
Flight results:
The express save VI feature and the Xbee receiving window both displayed a match of 0 results. This was due to the drift of the rocket in the wind, which caused the camera to miss the target. After each launch the wind would carry it at an angle which would not allow it to see the target, thus demonstrating that it worked as intended, displaying no “hazard” matches. Though the system never recognized a hazard in actual flight testing, it never flew over the intended hazard, and thus the resulting application of the program proved a success.
Match |
0 |
0 |
0 |
0 |
0 |
0 |
0 |
0 |
0 |
Sensor Package Mode of Operation
Each module contained its own unique set of sensors, the individual schematics for each can be seen below in Figures 10 and 11. The reconnaissance module contained a wide variety of atmospheric sensors and an IMU, while the thrust modulation contained an accelerometer and three-axis strain gauge rosettes. Each type of sensor was connected to its respective pin by use of ribbon cables that were connected to the MXP connector. The myRIO pallet, including its express analog and digital lines for the sensors, and both sets of TX and RX pins that were contained on the myRIO, were all used for the GPS and Xbee transceiver.
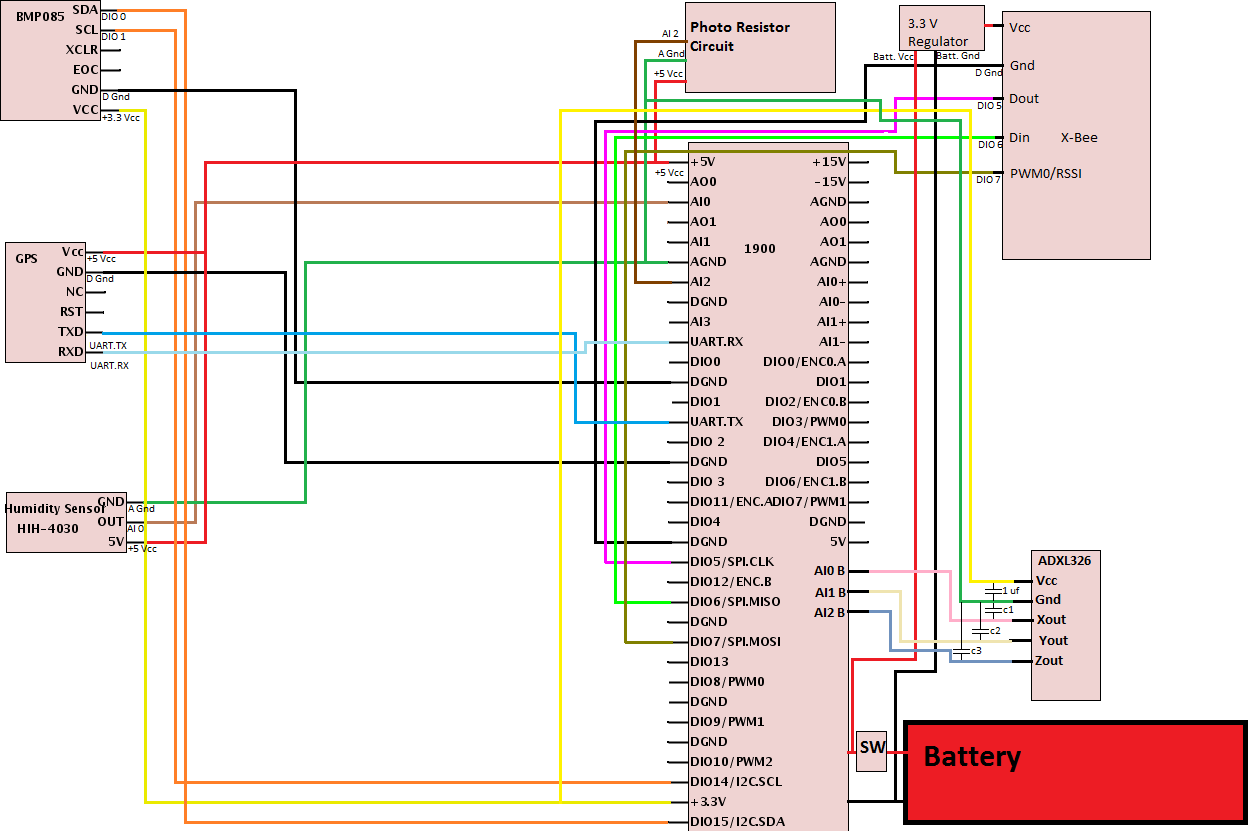
Figure 10: Reconnaissance Module Electronics
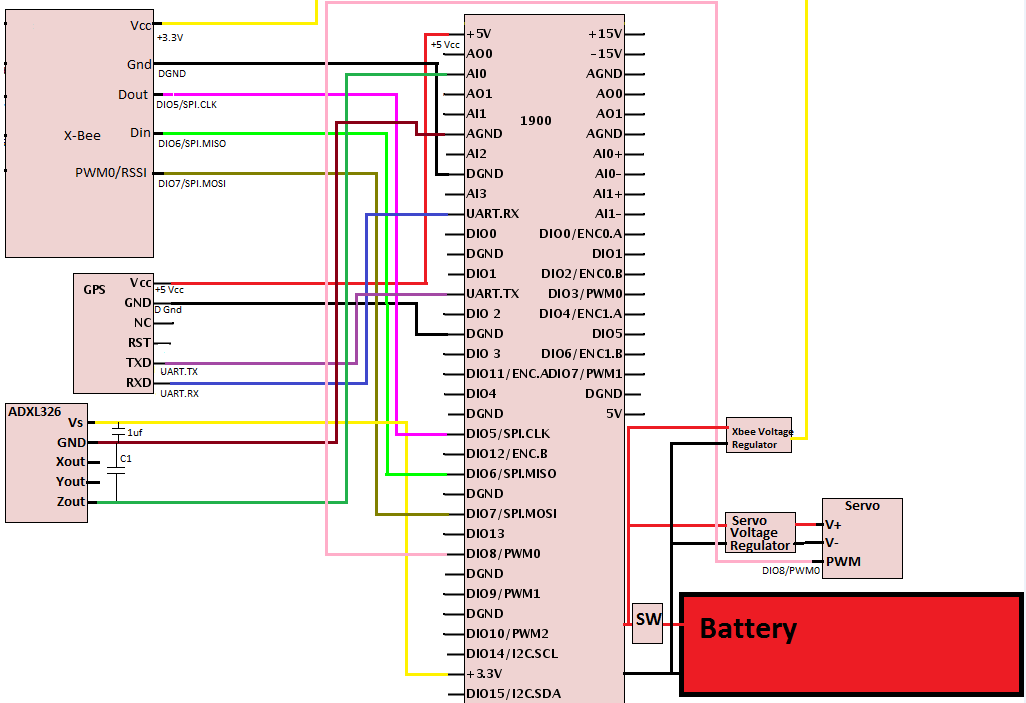
Figure 11: Thrust Module Electronics
The reconnaissance package was developed to ensure that it would record atmospheric data at preset time. This was determined to be 17 seconds after launch due to LabVIEW’s built in delay factor, Wait. Using this in conjunction with a flat structure allowed for perfect timing of 17 seconds before any atmospheric sensor would engage/function. The strain gauges incorporated the Convert to Strain function. This function, utilizing a while loop, ensured that the strain gauges properly functioned during the entire flight. All results were saved on the myRIO by the Express Save VI with the GPS results displayed on a home station laptop by a default Xbee window.
Sensor Package Results:
The first six recorded values of some selected sensors can be shown below in Table 1 as well as the receiving window of the Xbee transmission, X-CTU (Figure 12). Each set of data was recorded using the express function, write to measurement file. This allowed all the data to be saved in excel format to the myRIO. Applying a variety of numeric functions allowed for the resulting output to be represented in its corresponding unit.
Table 1: First 6 Recorded Results
| Pressure (Pa) | Humidity (%) | Photocell (ohms) | Strain (k Value) | Strain (k Value) |
| 60516 | 24.203 | 82879.83 | -0.3 | -0.1 |
| 60517 | 24.124 | 82044.95 | -0.3 | -0.1 |
| 60508 | 23.73 | 82460.51 | -0.3 | -0.1 |
| 60514 | 24.4 | 82460.51 | -0.3 | -0.1 |
| 6012 | 24.124 | 83944.96 | -0.3 | -0.1 |
| 60522 | 24.124 | 82669.69 | -0.3 | -0.1 |
| 60517 | 23.77 | 81633.12 | -0.3 | -0.1 |
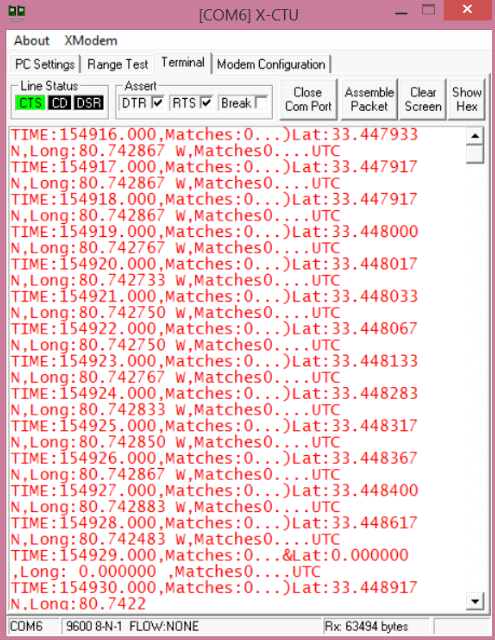
Figure 12: Receiving Window of the Xbee
Thrust Modulation System
The second payload subsystem was the thrust modulation system, and its corresponding electronic control system. The goal of this system was to modify the thrust curve to a desired shape, proving the experimental concept and ultimately using this modification to dictate acceleration, velocity, and apogee altitude. The control system also used a second myRIO independent of the reconnaissance module and was housed in the booster section of the vehicle. The sliding mechanism to modulate solid rocket thrust was activated by a high-torque servo (HS-7950TH), controlled through a closed-loop PID system. The strain gage circuitry was also housed and interpreted in this payload section.
The thrust modulation mechanism is situated below the thrust modulation electronics bay, as shown in Figure 13.
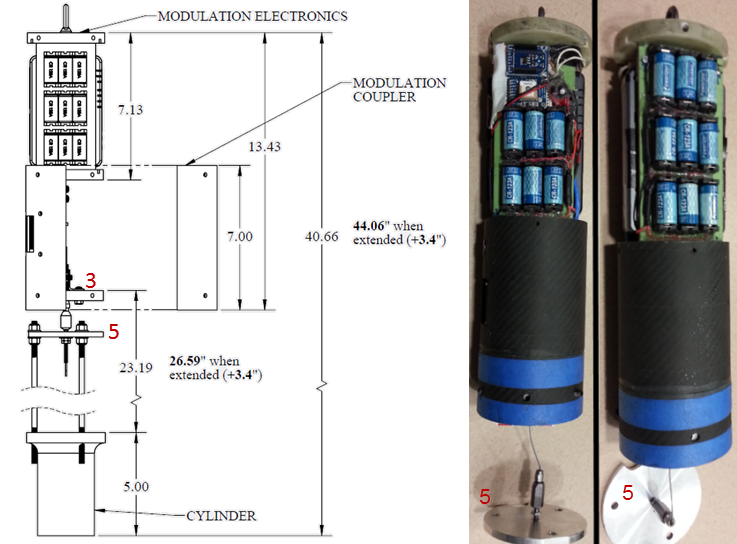
Figure 13: Thrust Modulation Electronics and Controls Bay
Thrust Mod Operation and myRio Controller
Thrust modulation was achieved by extending an aluminum cylinder fitted with a ceramic insert into the exhaust plume of the solid fuel rocket motor. The cylinder was activated by a high torque servo motor and controlled via a closed-loop LabVIEW program with the myRIO using feedback from the onboard accelerometer. The desired acceleration profile was preloaded onto the myRIO as a csv file; and was automatically read by the program at each time step of the control loop, and compared to the measured acceleration value at that iteration. The difference between the measured and desired acceleration was multiplied by an empirical correlation constant, found through testing motors on a test stand built by the team, to find the required change in the PWM signal. The output value was added to the pulse width input of the PWM block in the LabVIEW program to adjust the servo angle and the extension of the cylinder incrementally at each iteration. The accelerometer readings were then used as the feedback from the effect of the extension/retraction to continue the process.
Extending the cylinder gave the exhaust gasses a larger expansion chamber causing an under expansion of the exhaust, a decreased thrust, and decreased acceleration. The control loop was constantly attempting to match the pre-loaded acceleration profile by adjusting the size of the expansion chamber created by the cylinder and limiting the final altitude to the desired 3100 feet. The acceleration profile loaded onto the myRIO was calculated using an Excel flight planner created by the team. The predicted altitude, velocity, and acceleration profiles were calculated with a flight planner made by the team using Excel. Figures 14, 15, and 16, below show the modulated (red) and unmodulated (blue) flight predictions.
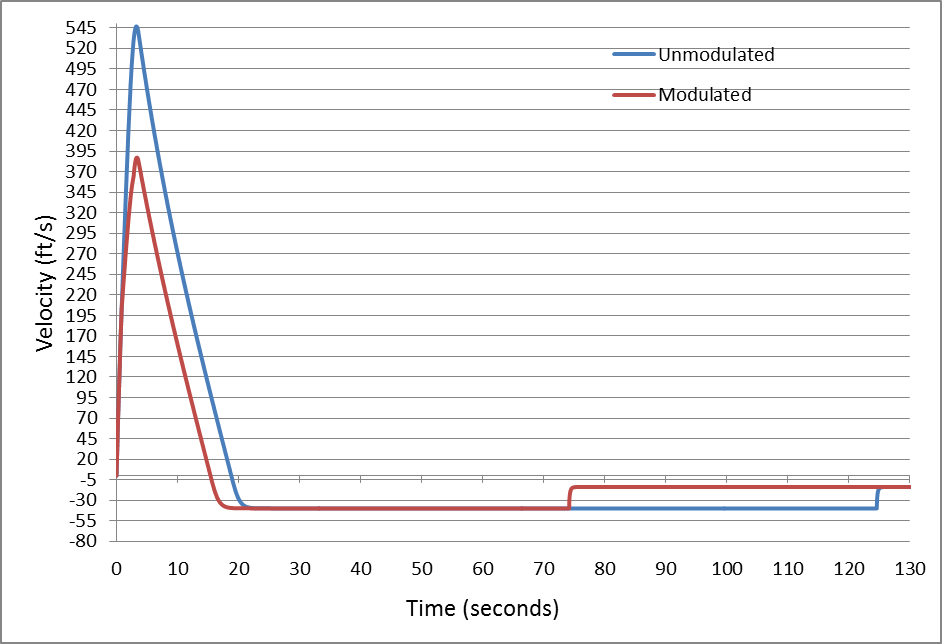
Figure 14: Velocity versus time during flight
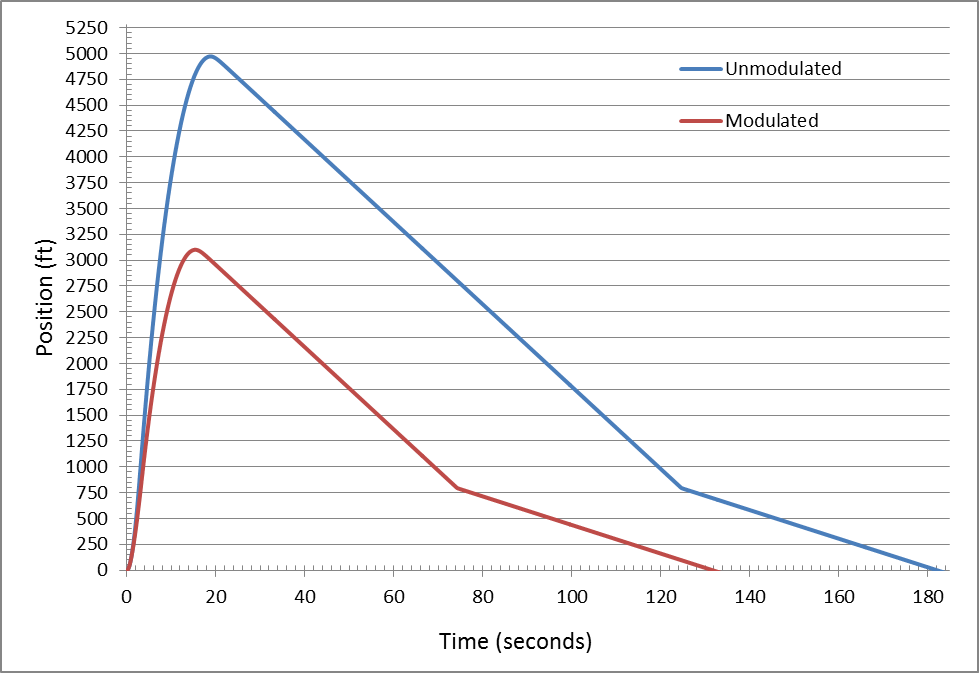
Figure 15: Position versus time during flight
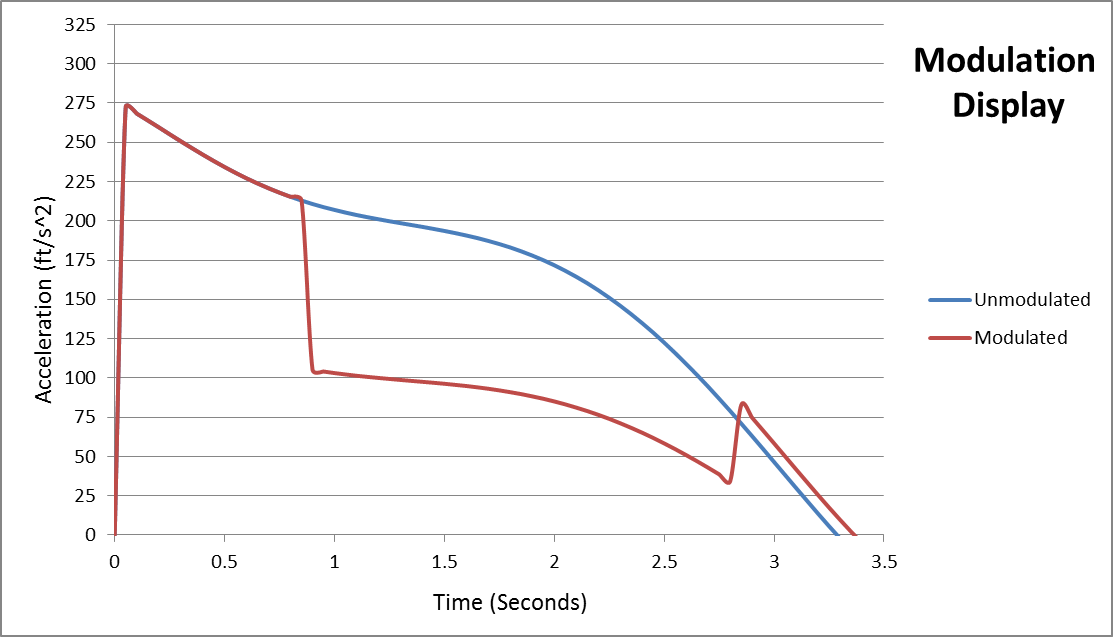
Figure 16: Acceleration during motor burn
For safety reasons, on startup, the LabVIEW program went through a flat sequence where first, the servo arm held the extension cylinder fully retracted such that no modulation in thrust will occur. Second, an acceleration of two (2) times gravity must be read for 0.5 seconds before part two of the sequence could begin. This eliminated the possibility of a false start due to a motor mis-start. At 0.5 seconds, the vehicle was predicted to be traveling at 110.0 ft/s. An additional wait time of 0.35 seconds was added to program in the third compartment of the sequence to allow the vehicle to reach a velocity of approximately 189.9 ft/s to ensure stable flight before thrust modulation began. This also gave the vehicle enough momentum to reach an altitude of 1000 feet to ensure proper recovery system activation in the event of a systems failure causing complete loss of thrust due to the thrust modulation system. In the event that the system reads acceleration below a 75% of the desired acceleration, the cylinder fully retracts, disengaging thrust modulation.
Experimental Process and Procedures
The ground testing experiments of the thrust modulation payload were conducted on the UNC Charlotte campus, in a student-built rocket motor test stand designed for this purpose.
Figure 17 Video 1, Static testing with no thrust modulation
The team first conducted testing on the test stand with no slider to verify manufactures specifications and have a baseline for future experiments that used the same type, size and lot of motors. (Figure 17, Video 1).
Figure 18: Video 1: Static testing with 3 inch extension
The team conducted numerous static testis on the test stand with the slider at known lengths from 0.5 inches up to 3 inches and measured the change in thrust compared to the baseline as well as visual comparisons of test as seen in Figure 18, Video 2.
Thrust Modulation System Results
During the first flight test, the thrust modulation system worked as planned, extending the cylinder into the exhaust stream, changing the thrust of the motor to decrease the measured maximum altitude of the rocket by around 40% as compared to the theoretical value with no motor thrust modulation effects. The thrust modulation system altered the height from 4,900 feet to 3236 feet and the vehicle was visually confirmed to have a stable flight with no visible oscillations during the takeoff and coasting phases, confirming that the effects could not have been due to variations in the motor thrust, wind, or flight angle effects as can be seen in Figure 19, Video 3.
Figure 19, Video 3 Full Scale Flight Video
Figure 20 compares the measured altitude from the altimeter with the predicted altitudes from the flight simulator. The rapid drop from apogee was due to a broken tether, which allowed the payload bay to drop to approximately 800 feet without being attached to the fin can which was attached to the drogue chute. At 800 feet, the main deployed and the predicted and measure altitude begin to run parallel again.
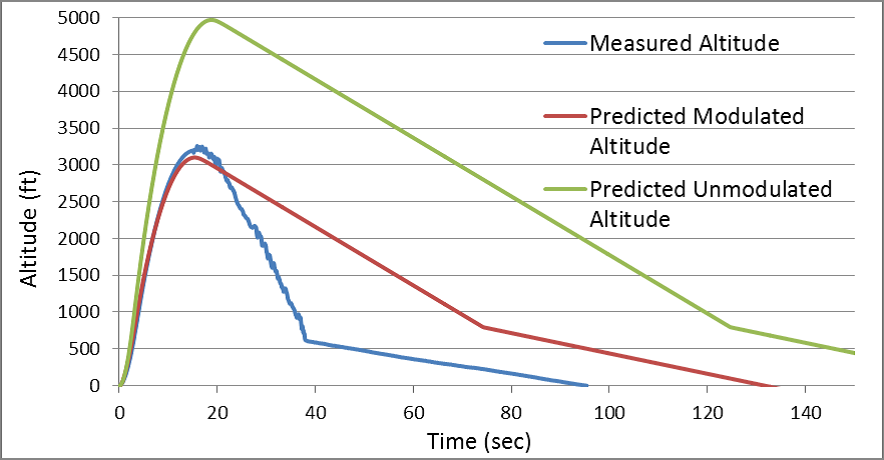
Figure 20: Measured modulated altitude vs predicted altitude from launch to apogee with percent difference
The measured data shows that the altitude during the launch phase was predicted within 25% as shown in Figure 20.
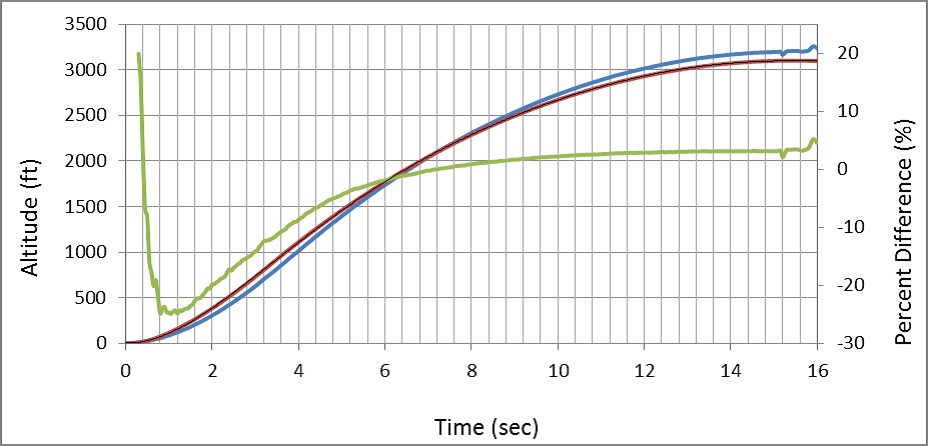
Figure 21: Measured modulated altitude vs predicted altitude from launch to apogee with percent difference
The differences between the measured and theoretical data (green) were higher in the first few seconds of the launch because of the low altitude values. After around 2 seconds, the percent difference was within 20% and after 7 seconds the percent difference was less than 4% confirming that the thrust modulation system worked exactly as planned and decreased the thrust of the motor according to the simulated profile required to reach the desired altitude. The percent difference between the target altitude, 3100 feet, and the measured apogee altitude, 3236 feet, was 4.28 percent.
Benefits of LabVIEW and NI Tools:
The use of LabVIEW and National Instruments hardware was essential to the success of this project. With the limited space and processing speed required, the NI myRIO fulfilled all of the project needs in one package. The built-in Wi-Fi feature of the myRIO allowed the team to access the myRIO without disassembling the entire vehicle, eliminating the need for a connection port, simplifying the launch process and saving critical space in the payload bays. The 64 connector pin-out featured on each myRIO allowed for additional sensor equipment above and beyond the standard requirement, making a better all-around package. The USB connector and the sheer number on both analog and digital I/O ports made for easy assembly and wiring of the entire system.
National Instruments provides a wide array of hardware support and options with their products. The amount of pin-outs allowed for customization of the scientific payloads beyond the standard required camera system and stress readings. The myRIO and LabVIEW software allowed the team to perform a number of different computing and data acquisition functions; from those as simple as reading and storing the atmospheric sensor data to writing the control loop for thrust modulation and converting the signal to PWM for precise servo control. The team used NI documentation and support as well as NI online discussion boards to great success.
National Instruments not only met the hardware requirements but also provided the beneficial and appropriate software codes and libraries the team needed such as IMAQ vision. IMAQ Vision allowed for the painless integration and control of a USB connected Logitech C525 camera. The library allowed for accessibility and control of the camera used for landing hazard detection. It also came outfitted with a wide range of image analyzing software that easily implemented. This allowed for a wide variety of options when analyzing captured images.
LabVIEW’s graphically oriented approach presented a variety of uses; everything from data acquisition to complex prototyping of integrated systems. LabVIEW’s great benefit is that it allows for easy testing of complex circuits. Throughout the fabrication process LabVIEW was used to analyze and search for errors in everything from simple wiring errors to complex analytical errors. Using the front panel’s variety of switches and knobs to simulate sensors allowed easy testing of all of the payload subsystems prior to each launch.
Without the many advantages that National Instruments products provided this project and its success would not have been possible. National Instrument products proved essential to the testing, fabrication, and integration of all systems throughout the vehicle. Without such a high speed, user-friendly system, the rocket would never have operated as it was intended.
Revisions that could be made:
The team is currently looking at switching the micro-processor on the test stand to a myRIO from an Arduino Uno, as the myRIO had not been released at the time the stand was built. This will speed up the data processing on the test stand and give more accurate results. Based on new data attained from the test stand, it will be possible to explore other methods of thrust modulation on a solid fuel motor or improve the algorithm used in the current system.
Project Overview Video:
Figure 22: Video 4: Culmination Video of Project
Total Project Time:
The project began in May 2013 with the development of the thrust modulation idea. From the development stage, the team designed and constructed a solid motor test stand and conducted both static and dynamic testing to verify the theory. In September 2013 construction on the half-scale rocket began, which also tested the theory statically. In January 2014 construction on the full-scale vehicle began. With the release and delivery of the first myRIO in late February 2014, the payload subsystem construction began with the first full-scale test flight with payload in March 2014. From concept to completion, the project took eleven months with a little under two months between the release of the myRIO and the completion of the payloads.
Conclusion:
In conclusion, the UNC Charlotte 49er High Powered Rocketry Club designed, tested and built a reusable launch vehicle that was capable of modulating thrust, recording atmospheric data as well as scanning the landing zone for hazards. The project was completed in eleven months and won the NASA Vehicle Design Award “for the most creative, innovative, and well-constructed overall vehicle design for the intended payload while maximizing safety and efficiency” as well as third place in the UNC Charlotte Senior Design Expo.
Figure 23: NASA Student Launch Award, Best Vehicle Design
- Mark as Read
- Mark as New
- Bookmark
- Permalink
- Report to a Moderator
Superb!
