- Document History
- Subscribe to RSS Feed
- Mark as New
- Mark as Read
- Bookmark
- Subscribe
- Printer Friendly Page
- Report to a Moderator
- Subscribe to RSS Feed
- Mark as New
- Mark as Read
- Bookmark
- Subscribe
- Printer Friendly Page
- Report to a Moderator
Software for frequency analysis of stabliographical signals for estimating the functional state of a person
Contact Information
Team Members:Pavel A. Marmalyuk
Faculty Advisors:Lev S. Kuravsky, Natalya V. Kholmogorova
Primary Email Address:ykk.mail@gmail.com
Primary Telephone Number:+7-926-119-03-18
Project Information
All parts (hardware, software, etc.) used to design and complete project:
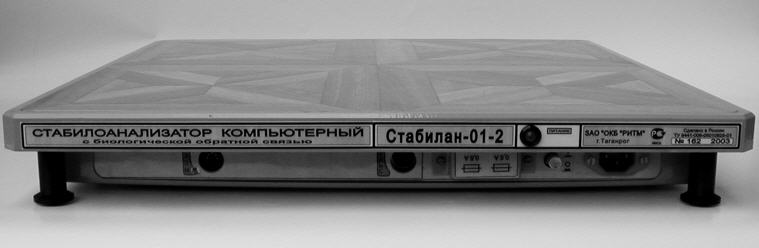
Stabilograph «Stabilan-01-2» (Special Design Office «Rhythm», Taganrog, Russia)
Rovermate Comus Adaptmate-057 Adapter Express Card (RS-232)
NI LabVIEW 8.2.1 Professional Development System
MS Office 2003
Describe the challenge your project is trying to solve.
The main challenge which the project is trying to solve is to provide opportunities for study and classify of human’s functional states on the basis of spectral analysis and wavelet representations of stabilographical signals.
Subtasks of the challenge:
It is necessary to propose a number of indicators of stabilographical signals which characterize peculiarities of the spectral density, and automate their mass computation using samples of stabilographical data for further statistical estimation.
As a rule, stabilographical signals reflect non-stationary physiological and neurological processes, so it is needed to create a tool for evaluating not only classical spectral characteristics of a signal (e.g., spectral density), but also indicators that correctly describe the changes of the signal components in time and in different frequency bands.
As physiologists during detection of pathological states with the aid of stabilogramms often analyze a large amount of data, it is topical to solve the task of automatic selection of typical fragments in stabilographical signals indicating different anomalies.
Since pathologies may occur only in certain frequency bands of a signal, the challenge of extraction of typical fragments corresponding to certain pathologies, cleaned from the noise, carriers or trend, is arise.
Describe how you addressed the challenge through your project.
Stabilographical signal (reflects changes of human’s body gravity center) is recorded with the aid of stabilographical platform «Stabilan-01-2» manufactured in the Special Design Office «Ritm» (Taganrog, Russia). A digital signal form is transmitted to the serial port of the PC (sample rate is 50 Hz) and registered by using standard NI VISA solutions.
After signal recording it is possible to carry out the frequency analysis based on the discrete Fourier transform and Daubechie’s discrete wavelet transform.
The ways to address the challenges (in the order listed in the section «The challenge which the project is trying to solve») are implemented in the NI LabVIEW graphical programming environment and further described.
The developed software allows carrying out a classical digital spectral analysis of stabilographical signals. Signals are smoothed by cosine Hamming window.
To assess the general frequency structure of the signal, user can explore the curves of signals’ spectral density, which appear on the program display.
The resulting spectra often have a noise component, which may misinform the user and distort the spectrum curve. To avoid such phenomena, the user may average the spectral curve (the number of averaging is defined by the user).
Using the estimate of spectral density, there are calculated some characteristics of the spectrum curve, which established in the stabilometric, such as:
Dividing frequency in certain frequency band
Dividing frequency fdiv is a value of frequency in certain frequency band (f0 £ fdiv £ f1), where the specified percent of the total spectral density integral is reached. The developed algorithm uses the Simpson’s numerical integration method.
Frequencies of spectral density curve’s peaks
User can get a list of frequency values of spectrum curve’s peaks and corresponding values of spectral density, ordered by decreasing of spectral density values.
To ensure the accompanying statistical analysis of stabilogramms, spectral densities, the characteristics of spectral curves, and the wavelet coefficients, a mass export of this data could be implemented. To carry out the mass export a user must load some sample of stabilogramms and set adjustable parameters of calculation. The mass export module perform saving of characteristics into the MS Excel workbook.
Fourier transform apparatus give us quite simple formulae and transparent interpretation of results but it have some disadvantages. For example, this transform does not distinguish the signal, which is the sum of two sinusoids, from the signal with consecutive inclusion of sinusoids. It can give incorrect results for signals with lots of sharp changes, and moreover, does not provide information on the distribution of frequencies in time. Therefore, to study the evolution of spectral density estimates the short-time Fourier transform is proposed.
The developed software allows constructing three-dimensional diagrams representing the evolution of spectral density of a non-stationary stabilographical signals by using the short-time Fourier transform. This method allows to investigate regularities in the evolution of spectral density estimates within the specified frequency and time intervals, and also to study interconnections of signal components.
For easer perception, surface color filling is carried out using the rainbow scale of surface color and value correspondence with a gradient transition. The developed software provides an opportunity to draw surfaces for any intervals of time (within the duration of stabilogramm) and any frequency ranges.
For the detailed studying of frequency components’ temporal dynamics there is a tool for drawing charts of spectral density evolution surface’s slices along the frequencies of interest (this method is more convenient to identify the relationships between the components of the signal).
Investigated signals are not always periodic and may have lots of sharp changes of amplitude. Traditional spectral analysis may not give accurate results for non-periodical stabilograms with transient processes and local peculiarities.
Wavelet-analysis has clear superiority over the traditional spectral analysis since it yields correct representation in case of transition (non-stationary) processes and keeps more useful information about the object behavior under study. These and other advantages have made this approach very popular among researchers of different specialties now. Its discrete variant is used here to represent initial signals in the form of points of a certain metric functional space with a wavelet-basis. Daubechie’s discrete wavelet transform makes it possible to reveal differences in process characteristics for diverse scales and in different time points of some time interval under study.
Results of discrete wavelet transform are used for wavelet diagrams construction. Wavelet diagram is represented by a surface in three-dimensional space. This form of presentation of the stabilographical signals allows considering its evolution in different frequency bands.
With the help of the developed software one can build the binary representations of wavelet diagrams, which reflect in which frequency intervals and for which moments of time wavelet coefficients are significant.
Significance of wavelet coefficients is determined by a set of thresholds, as follows: if the certain wavelet coefficient of corresponding wavelet diagram level is less than the threshold, then the binary diagram displayed it in black color, if more than a threshold - in white color. This presentation simplifies the interpretation of computed wavelet spectra.
The developed software provides an opportunity to receive the average assessments of thresholds for different detailing levels of a signal. To obtain these estimates it is enough to have a stabilographical signals’ sample of homogenous group of subjects. Interpretation of the binary diagram depends on the sample of stabilographical signals which are used for thresholds calculation.
Wavelet coefficients obtained by the Daubechie’s discrete wavelet transform (4-th order) are used to diagnosing of pathological states with the aid of Hamming’s relaxation neural networks.
Hamming’s relaxation neural networks, which advantages are in use here, are characterized by direct and inverse information distribution, with data circulation taking place until balance state. Synapse weights are calculated only once, before the network operation. The matrix of synapse weights corresponds to different classes to be recognized. This process may be considered as training that is carried out using information about recognition patterns calculated with the aid of available patterns. In contrast to traditional trained structures, a relaxation network memorizes patterns before actual data input. The main reason for its use is capability to be tuned up for recognition when only small sample of signal patterns is available and other types of trained structures cannot be trained properly (one pattern for each recognition class is sufficient).
The nature of Hamming network operation is in identification of the typical pattern closest to the input vector in the given metrics (Hamming, Euclidean etc.) After initial estimation of the distances between the input vector and the typical patterns remembered in the course of training the Hamming network starts cyclic calculations using back connections during which network outputs corresponding to typical signal patterns are trying to mutually suppress competing output signals. As a result of this process the activated one is the output of so-called winning neuron that usually corresponds to the pattern nearest to the input vector. The number of a winning neuron identifies the recognized pattern. The role of the first layer is quite tentative: Hamming network uses its weights only once, after that this layer is not used for calculations.
The recognition procedure is consequently executed for digitized time realizations of fixed time duration extracted from the analyzed signal. After each execution of the indicated procedure the beginning of the studies realization is shifted along this signal for quite a small time interval (thus the considered fragment "slides" from the beginning to the end.) First of all, current signal realization of some prescribed standard length, which is obtained from a gage at a given checkpoint, is converted into wavelet representation. Then, this representation enters the Hamming network, which connection weights have been calculated using wavelet representation of available typical anomaly signal patterns as well as signal patterns corresponding to normal patient state. After cyclic computations, the properly tuned Hamming network converges to a number of the closest typical pattern immediately. After that the final conclusion on presence or absence of pathology in the analyzed signal is made.
The two ways are applied for signal filtering: direct and inverse wavelet transform with coefficients zeroing and the band filtering.
Using the wavelet transforms tool user can specify the minimum and maximum levels for the wavelet diagram. If the minimum level of greater than unity or maximum level is less than the maximum possible level (these conditions can be performed simultaneously), then coefficients related to this levels are set to zero. After zeroing the inverse wavelet transform is carried out and it is impossible to restore the relevant components of the signal. Thus the signal filtering is implemented.
To facilitate the identification of pathologic fragments in the studied signals, which form the bank of reference patterns of pathologies, there is a possibility of accumulation of fragments corresponding to normal states of subjects and their comparison with the studied signals in different frequency ranges. Fragments’ filtering is carried out using the Butterworth’s band-pass filter for frequency bands specified by experienced physiologists.

Video of Project:
