From Friday, April 19th (11:00 PM CDT) through Saturday, April 20th (2:00 PM CDT), 2024, ni.com will undergo system upgrades that may result in temporary service interruption.
We appreciate your patience as we improve our online experience.
From Friday, April 19th (11:00 PM CDT) through Saturday, April 20th (2:00 PM CDT), 2024, ni.com will undergo system upgrades that may result in temporary service interruption.
We appreciate your patience as we improve our online experience.
University: Norwegian University of Science and Technology (NTNU)
Team Member(s): Georgi H. Yordanov (PhD Student)
Faculty Advisors: Ole-Morten Midtgård (Supervisor)
Email Address: georgihy@uia.no
Country: Norway
Current-voltage characteristics (I-V curves) and operating temperatures of 10 photovoltaic (PV) modules, as well as solar irradiance and ambient temperature, are recorded on a daily basis. I-V curves are swept every minute. The modules are operated at the maximum power point (MPP) in between. Module and ambient temperatures are recorded also at night.
NI PCIe-6363
NI PCIe-7851R
NI LabVIEW 8.6
A surprising result from the present work is the measurement of unexpectedly high peak irradiance values at such high latitude (58°21'N). Short bursts exceeding 1500 W/m2 were found possible. Surprisingly, the values obtained by the present author exceed the extraterrestrial solar irradiance (which is not attenuated by the atmosphere) at an altitude of only about 60 m a.s.l. Very few laboratories in the world were reported to record irradiance with resolution below 1 minute. A good weather data set is needed in order to identify the typical operation conditions of PV inverters at a given location.
In an older test setup, modules were operated at open circuit between the I-V curve sweeps because a maximum-power-point (MPP) tracking algorithm was not implemented in the data acquisition software. Since no electric power was extracted from the modules most of the time, their temperatures must have been higher than in case they were operated always at the MPP. Due to the negative temperature coefficients of a PV device’s voltages and maximum power, the obtained results about modules’ efficiencies were somewhat pessimistic. Furthermore, the measured I-V curves contained small number of data points (between 10 and 50), especially at low irradiance levels. Consequently, the flat regions of the curves had poor resolution. Finally, low-cost, home-made electronic loads with very poor power-dissipation capabilities were used in that setup. The peak irradiance values reported in the earlier study were only about 1150 W/m2 which can be attributed to the poor temporal resolution of the recorded data set (20 min).
The PV modules are installed in an open-rack configuration on a flat roof at the University of Agder in Grimstad, Southern Norway. The instantaneous solar resource availability is measured by two irradiance sensors, mounted co-planar with the PV modules. Ambient temperature is measured using a 4-wire Pt100 probe surrounded by a radiation shield and connected to a transducer. Module temperatures are measured by K-type thermocouples fixed with conductive paste and insulator tape at the back of each module. The LabVIEW code automatically records temperature readings in 1-minute intervals. The I-V curves are measured using a commercial multichannel electronic load system (Dynaload MCL488) controlled by custom-made LabVIEW code via PC-based data acquisition boards (NI PCIe-6363 and NI PCIe-7851R). Currents and voltages are monitored locally at dedicated outputs on the electronic load, and I-V curves are obtained by varying the resistance of each load.
When choosing the sweep time for the I-V curves, the difference in the time constants of different module technologies should be taken into account. Some module types require sweep times of at least a few hundred milliseconds for obtaining accurate I-V curves. In some cases the speed of the input/output (I/O) computer hardware may become the ‘bottleneck’ imposing even higher sweep times. However, too long sweep times make the recorded I-V curves vulnerable to irradiance instability. An optimal value should therefore be chosen as a trade-off between these considerations. In this system, I-V curves are recorded simultaneously from each module in 1-second sweeps, and the procedure is repeated every minute (except at irradiances below 30 W/m2). One I-V curve contains about 4000 data points. This high number is imposed by the need to achieve sufficient resolution of the I-V curves at the larger currents in the wafer-based Si modules, especially at high irradiance. Simplified post-processing is then possible for noise cancellation in the raw I-V data. The limited sampling rate of the I/O boards eventually determines the minimum sweep time. Further reduction of the sweep time results in underestimation of the measured voltages by LabVIEW.
Rapid irradiance changes may result in incomplete I-V curves. In this case, repeated scans are performed up to 8 times in an attempt to obtain complete curves from all the modules. The raw I-V curves are stored on a PC, and an additional file stores the key electrical parameters for each module, including temperatures and environmental data. The LabVIEW graphical interface shows the most recent recorded I-V curves from all modules and their extracted parameters. Based on the I-V data, a LabVIEW routine smooths the power-voltage (P-V) curve prior to Pmax estimation, to avoid an outlier becoming a false maximum power point (MPP). Between I-V curve sweeps, each module is operated as close as possible to the MPP in order to maintain temperatures similar to a typical PV installation equipped with maximum-power-point tracking (MPPT). In MPP-tracking mode, the operating currents and voltages of each module, and irradiance readings from the reference cell, are displayed in real time. Simultaneous values of power and irradiance are recorded at high resolution for accurate energy accounting. The MPPT is based on the last I-V curve as a starting point and uses the real-time irradiance of the reference cell to approximate the true Imp. Real-time values of power from the MPPT are stored as the average of the past 1 second.
The real-time irradiance data set (of 10 ms resolution) is useful for studies of over-irradiance and rapid changes in irradiance from fast-moving clouds, in which case the MPPT can become inaccurate. However, large data files are created each day that demand both storage and computing resources.
Solar elevation and azimuth angles, as well as air mass (AM) factors corresponding to clear-sky conditions, are calculated and recorded at the time of each I-V curve sweep. Astronomical algorithms are used to calculate the position of the sun. An approximated formula is then applied to determine the air mass from the apparent solar elevation.
For two of the modules, the equivalent cell temperatures (ECTs) are also calculated following IEC 60904-5.
LabVIEW and the NI boards allowed for achieving a flexible and versatile data acquisition. Recording irradiance and I-V data with very high-resolution has brought the present research to an outstanding international level. The author has 4 papers accepted for the upcoming 38th IEEE Photovoltaic Specialists Conference (PVSC) in Austin, Texas as well as for the 27th European PV Solar Energy Conference in Frankfurt, Germany. One of the papers was selected for an oral presentation at the IEEE PVSC, and was also invited for submission to the IEEE Journal of Photovoltaics. Description of the experimental setup and preliminary results were published in the conference proceedings of the 37th IEEE PVSC held in 2011 in Seattle, WA (see the attached manuscripts).

The outdoor test setup. Click on image to see a larger version.
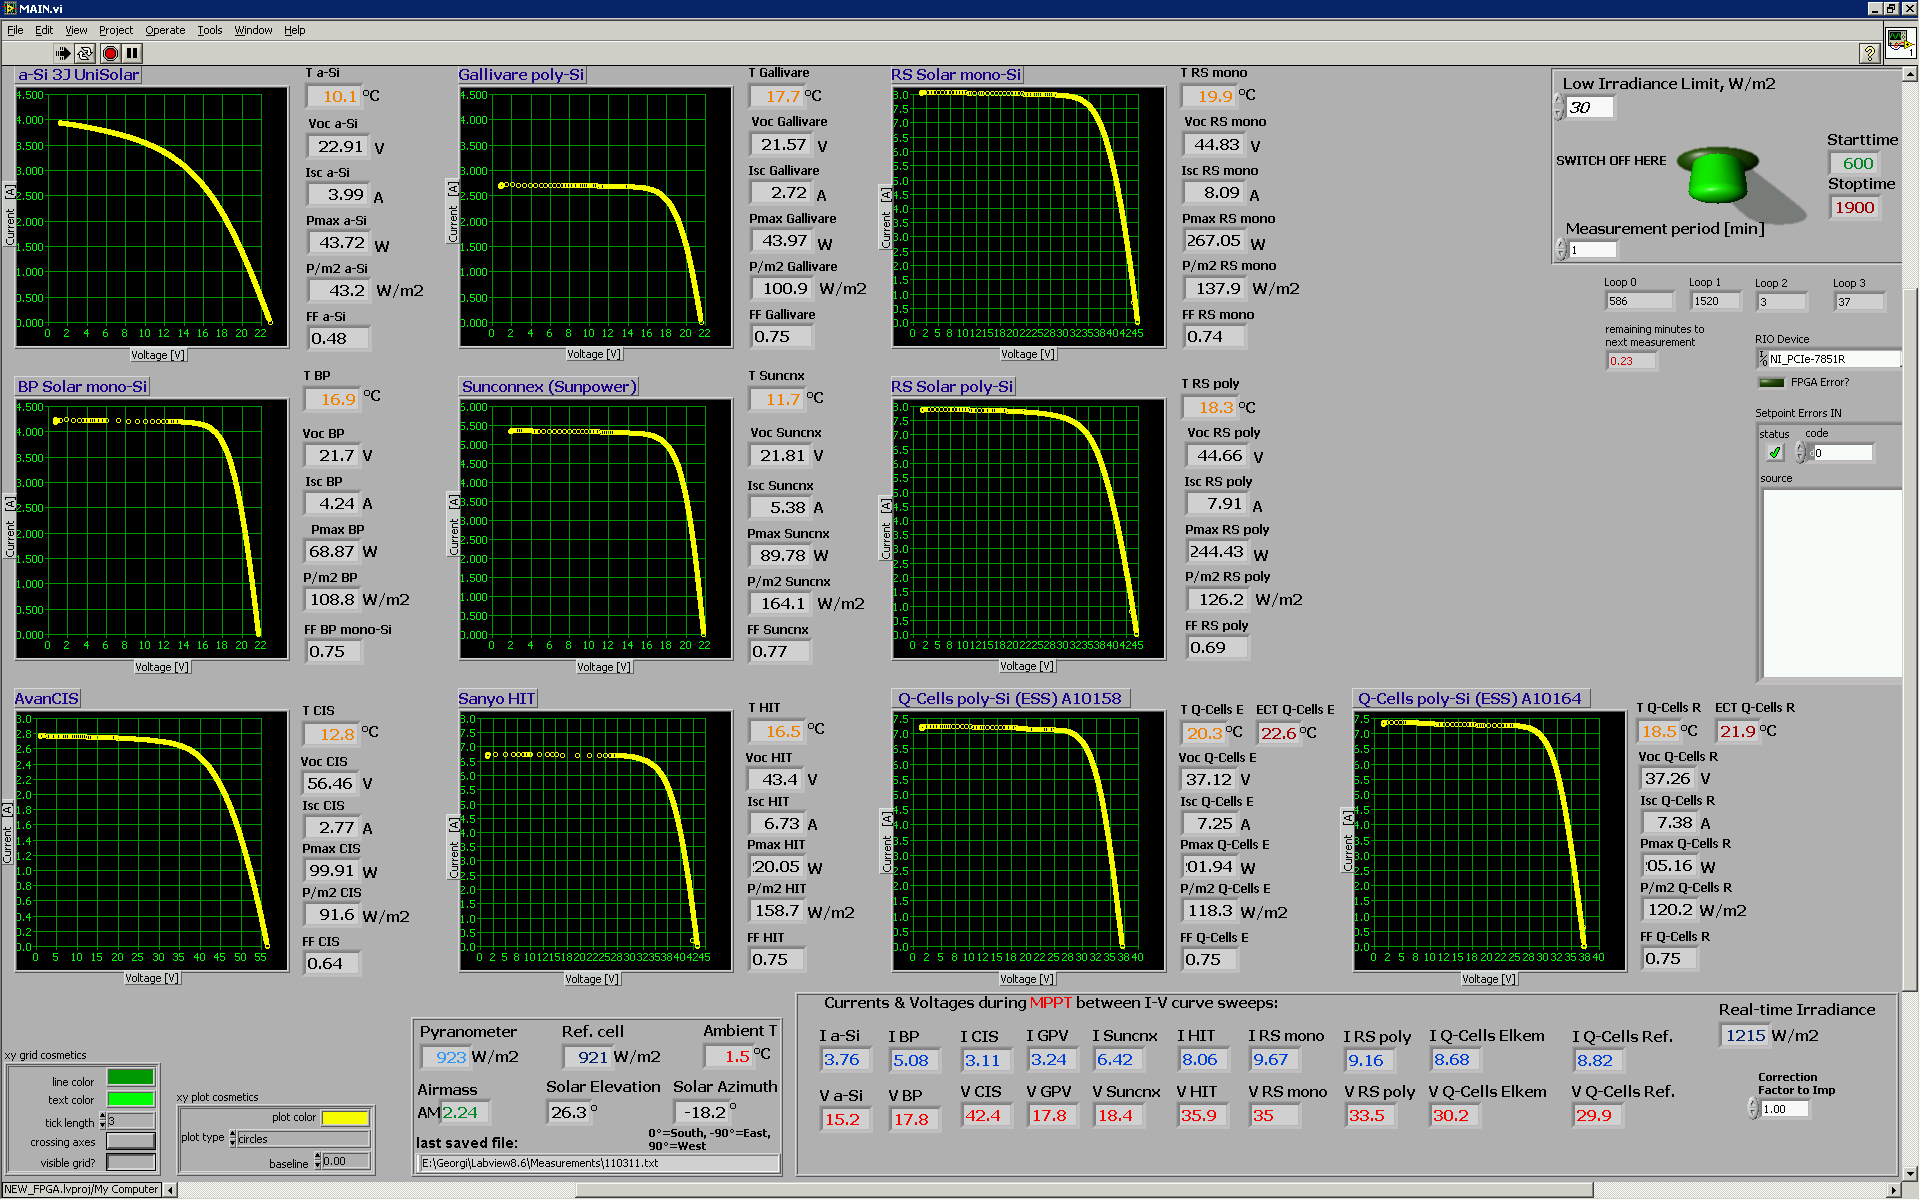
The graphical user interface (GUI). Click on image to see a larger version.

The project sub-VIs. Click on image to see a larger version.
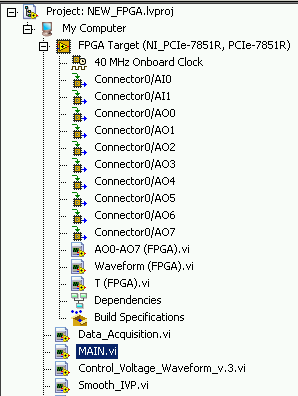
FPGA tree.
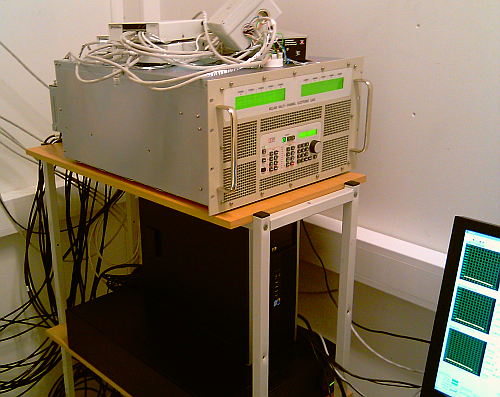
The data acquisition hardware.
A video composed from still images of the research platform recorded with a TV camera.
