From Friday, April 19th (11:00 PM CDT) through Saturday, April 20th (2:00 PM CDT), 2024, ni.com will undergo system upgrades that may result in temporary service interruption.
We appreciate your patience as we improve our online experience.
From Friday, April 19th (11:00 PM CDT) through Saturday, April 20th (2:00 PM CDT), 2024, ni.com will undergo system upgrades that may result in temporary service interruption.
We appreciate your patience as we improve our online experience.
Contact Information
University: Universidad de Antioquia. Medellín- Colombia
Team Members(s):
Frank Alexander Ruiz Holguín. Electronic Engineer.
Yuhan Arley Lenis Rodas. Mechanical Engineer.
Juan Fernando Pérez Bayer. Mechanical Engineer. PhD
Thermal Machines Laboratory- Group Efficient Management for Energy - GIMEL-
Faculty: Engineering
Tels: (57)(4) 2198547 – 2198549 – 3152763244
Email Address:farh40@yahoo.com , juanpb@udea.edu.co, yuhan.lenis@gmail.com
Project information
Title: KAPOK: EVALUATION OF ENERGY POTENTIAL OF THE MAIN FOREST SPECIES IN COLOMBIA
Description:
Software designed for monitoring, data acquisition and processing of evidence obtained in gasification process and characterization of solid fuels.
Products:
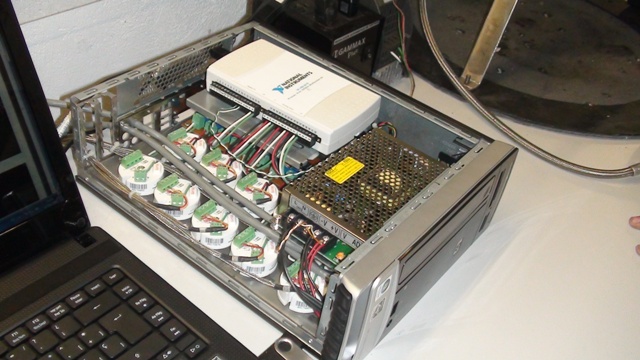

Figure. Hardware and software images
The challenge
Characterize the gasification process of the main forest species of greatest energy potential in Colombia, to determine the viability to develop energy programs generation with biomass in the country,and to investigate the effect of the type of biomass and its physical-chemical properties in the characteristic parameters of the thermo chemical process.
The solution
We designed, developed and implemented a complete system of instrumentation and monitoring using LabView. The experimental installation (see Figure 1) in addition to providing the characterization service of solid fuels, allow developing studios to gasification and combustion process. The study was performed in a co-current fixed bed gasifier to laboratory scale. To characterize the process, the system monitors and acquires temperature and flow data that alert the state of gasification of biomass at all times of testing and real-time.
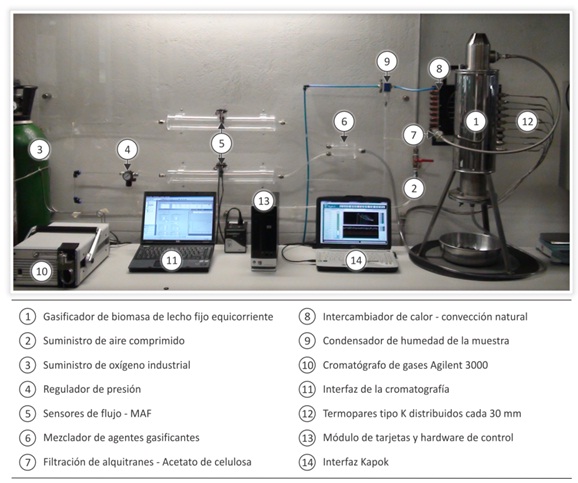 Figure 1. Mounting the experimental installation
Introduction
In an effort to associate the software developed in LabView, with the ecological sense that move the GIMEL group to study the biomass, this application has been named Kapok, name with whom he also often is called to the Ceiba pentandra, a of the most recognized species in the tropics zones of both hemispheres, more for its cultural value that by the very usefulness of its wood, the Kapok tree has since pre-Columbian times a mystical significance and a historic value for different cultures the countries of Central and South America and some parts of Africa and Asia. This project enable the solid fuels characterization and allow to develop studies of gasification process and biomass combustion,considering the conversion process of wood in gas in a downdraft reactor (seeFigure 2) to determine the feasibility to develop programs clean energy generation with biomass in the country, energy produced in an efficient andaffordable for the community to favor the non-interconnected electrically speaking areas of our territory.
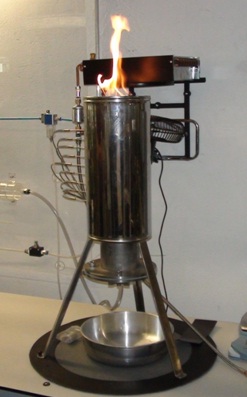
Figure 2. Co-current fixed bed gasifier to laboratory scale (downdraft)
Application Description
The developed application uses a data acquisition card from National Instruments and LabView program; it can process the acquired data during the gasification process and report the interest results for a further analysis. They receive signals from three flow sensors arranged in the flowlines of both gasifying agents and the sample for chromatographic analysis and the signals of thermocouples arranged along the gasifier. Thus, you can register with Kapok the thermochemical properties of solid fuels, temperatures and flows capture and calculate the results of each experiment. The figure 3,shows the block diagram of the overall scheme of the experimental facility developed.
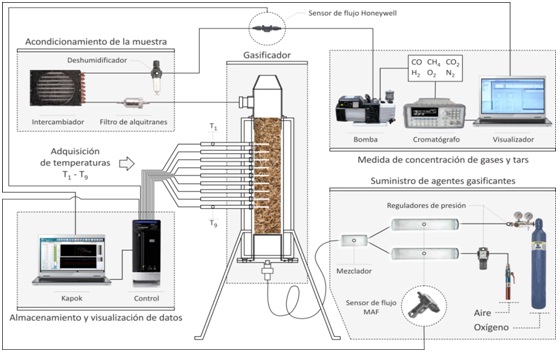
Figure 3. Block diagram of experimental installation
Initially the user enters the generalities and the thermochemical properties of solid fuel.Then the algorithm validates the entered values, warns if required to correct some field and offers the possibility of automatic correction for the analysis fields. Once completed the properties entry stage, the user must enter into thetesting space. In case of failure to create a path for saving test data, awarning appears in the screen and then a window for selecting path that will allow to save of experimentation files. When the program has registered the path where the tests are saved, the icon will enable the initiation of testing and data acquisition. When the experiment is over, the process results will bestore in an Excel spreadsheet for further analysis. The Figure 4, shows the tab "properties ", space that will begin each experiment. At this stage the user can: Select name and family of the species when it comes from lignocellulosic biomass, elemental analysis, proximate analysis, atmospherics properties and test conditions.
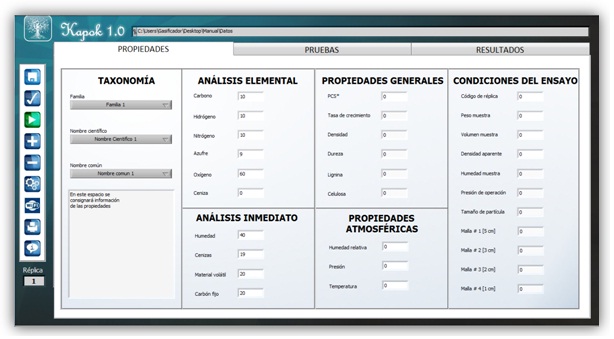
Figure 4. Tab properties– Kapok® software
When you finish entering the properties of solid fuel and the test, the user can enter to the second tab, titled "Tests ",which shows the temperature and flow fields as shown in Figure 5. In this space the user must remain during the experiment.

Figure 5. Tab Tests – Kapok® software
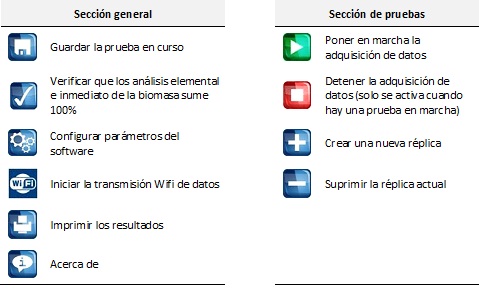
Figure 6. Buttons on the user interface
The Figure 7, show the application that allows you to communicate remotely with a PC that is connected to a network wirelessly usingWiFi technology. You can also see the application that allows the remote user to monitor the status of a running test.
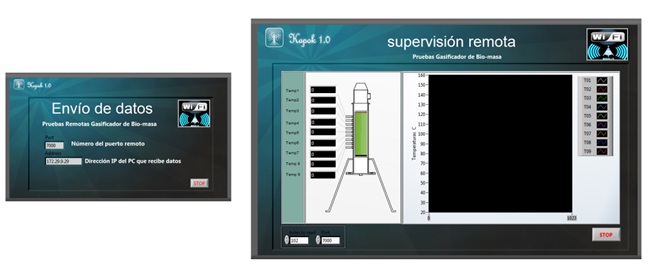
Figure7. Interface with wireless remote monitoring
Conclusions
Very good aplication and his future use in colombia!
Hey there,
Thank you so much for your project submission into the NI LabVIEW Student Design Competition. It's great to see your enthusiasm for NI LabVIEW! Make sure you share your project URL (https://decibel.ni.com/content/docs/DOC-16372) with your peers so you can collect votes via "likes" for your project and win. Collecting the most "likes" gives you the opportunity to win cash prizes for your project submission. I'm curious to know, what's your favorite part about using LabVIEW and how did you hear about the competition?
Good Luck, Liz in Austin, TX.
Excelente trabajo....Felicitaciones
Un buen trabajo de Ingeniería Colombiana. Me gusto mucho la forma como supervisan y monitorean las variables del proceso, aunque tengo muchas dudas sobre que tan preciso es el sistema cuando hace detección de fallas y alarmas del sistema, porque en varios trabajos en el área de supervisión y diagnóstico de fallas afirman que así como hay buenos sistemas para detectar fallas, también hay sistemas que detectan FALSAS fallas y FALSAS alarmas, lo cual, es un gran inconveniente que deben considerar los sistemas de supervisión. Además, este sistema sería mucho más interesante si se incorpora una etapa de PREDICCIÓN de posibles cambios en el comportamiento del proceso. Lo anterior permite tener un sistema de supervisión más eficiente y más robusto para detectar fallas del sistema.
Excelente trabajo y lo mejor es que es hecho en Colombia.
buen trabajo , ya lo habia visto en el NI Days Colombia
Excelente trabajo, felicitaciones y me alegro por Colombia!
Good Job, Congratulations
HERMANITO TE FELICITO POR TAN GRANDE Y EXELENTE TABAJO QUE DIOS TE BENDIGA Y SIGUE ADELANTE. Y LO MEJOR DE TODO ES QUE ES HECHO EN CASA

