- Document History
- Subscribe to RSS Feed
- Mark as New
- Mark as Read
- Bookmark
- Subscribe
- Printer Friendly Page
- Report to a Moderator
- Subscribe to RSS Feed
- Mark as New
- Mark as Read
- Bookmark
- Subscribe
- Printer Friendly Page
- Report to a Moderator
Basic LabVIEW Troubleshooting Techniques for FRC
One of the first challenges every programmer faces when beginning with a new programming environment is learning how to troubleshoot their code. There are several simple techniques that can help save you a great deal of time when trying to find the source of a problem with your code.
Probes
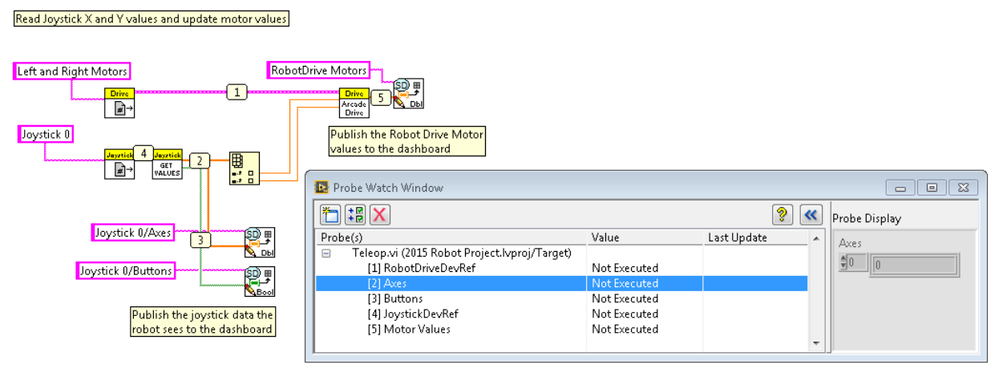
Probes tell you the current state of the data on the wire they are attached to in your program. In the screenshot below you’ll notice small numbered icons placed on the wires between subVIs in my code. To create these probes, right click on a wire and select Probe. Once the probe is placed, the Probe Watch Window automatically shows up. As your code is executing the Probe Watch Window will continuously update with new data values each time new data is passed on that wire. If I suspected an issue may be occurring in my Teleop.vi and had placed the probes as seen below I would be able to tell if I had a hardware connection or refnum naming issue by looking at probes 1 and 4 so see if they populate with values. Probes 2, 3 and 5 would tell me if I was receiving correct data and sending correct values to my motors. For more on this follow this link: Using the Probe Tool
Keep Code Organized
Disorganized code can be very difficult to debug or ask for help with. The code snippet below has identical functionality to the code above, but it is much more difficult to read. Some of these functions have wires going backwards, and for others such as the index array function, it is near impossible to tell what is an input and what is an output. You may know what your code is doing today, but in two months it may be very difficult to remember exactly what it's purpose is. It is easy to resolve issues like this through organization, block diagram comments, and by using the automatic Diagram cleanup tool in LabVIEW, the item that looks like a broom (highlighted in red in the image). Click it and LabVIEW will attempt to organize your entire block diagram in a logical format, that reads left to right. The code below will very closely resemble the code above after running this tool. You can also run the cleanup tool on sections of your code by highlighting a section and typing <CTRL>+U.
Highlight Execution
Click the light-bulb icon in the toolbar of the block diagram (highlighted in red below) to turn on highlight execution mode. While highlight execution mode is enabled, you will see dots on your block diagram flow along the path the code is currently executing. If you are unsure what exactly your code is doing, or where to begin troubleshooting, this tool can help you find where your code is getting stuck, having errors, or returning bad data. For more information see this link: Execution Highlighting
These are some of the basic techniques. There are many more tools LabVIEW provides you to debug your application. See this link for more information: LabVIEW Debugging Techniques


