From Friday, April 19th (11:00 PM CDT) through Saturday, April 20th (2:00 PM CDT), 2024, ni.com will undergo system upgrades that may result in temporary service interruption.
We appreciate your patience as we improve our online experience.
Virus scan in progress. Please wait to download attachments.
Introduction
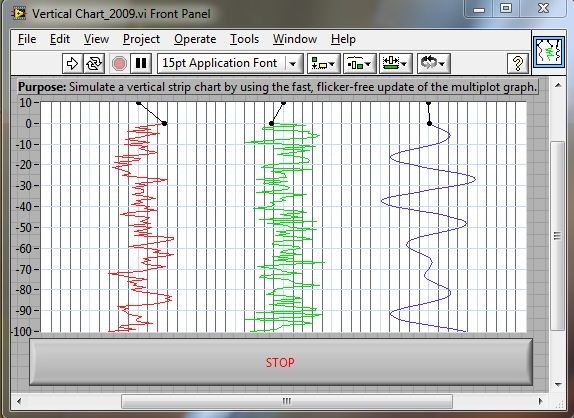
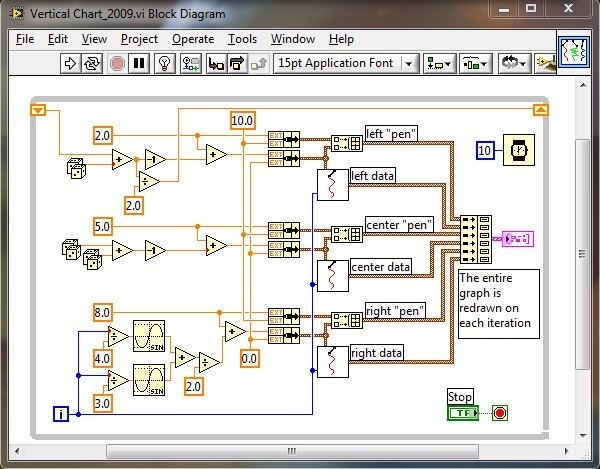
This example demonstrates a method for implementing a vertically scrolling strip chart using the standard Waveform Graph Control in LabVIEW. As Waveform Graphs may be continuously redrawn, the example create individual data streams in an iterative process; such that, the data may appear as scrolling from top to bottom.
Note: For help with specific functions used in this example, please use CTRL+H to view the LabVIEW Context Help.
Patrick Corcoran Application Engineering Specialist | Control National Instruments
Example code from the Example Code Exchange in the NI Community is licensed with the MIT license.